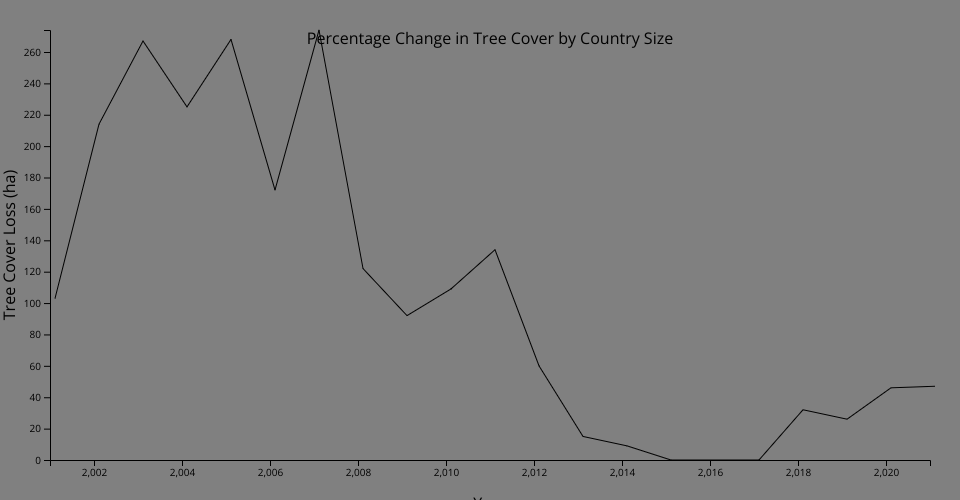
Line chart visualization which includes the amount of tree cover loss per year to visualize the change in global tree cover since 2000. This data is for 30% or greater density tree canopy forest for Afghanistan.
MIT Licensed
Line chart visualization which includes the amount of tree cover loss per year to visualize the change in global tree cover since 2000. This data is for 30% or greater density tree canopy forest for Afghanistan.