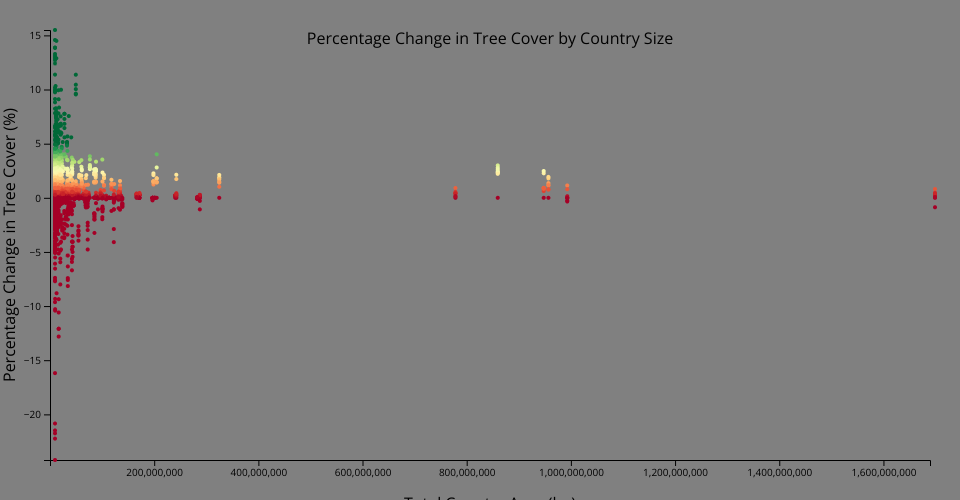
Scatterplot visualization which includes the total area per country on the x-axis and percentage change in tree cover on the y-axis, to visualize the change in global tree cover since 2000. This includes color mapping as a redundant channel demonstrating the percentage change in tree cover.
MIT Licensed