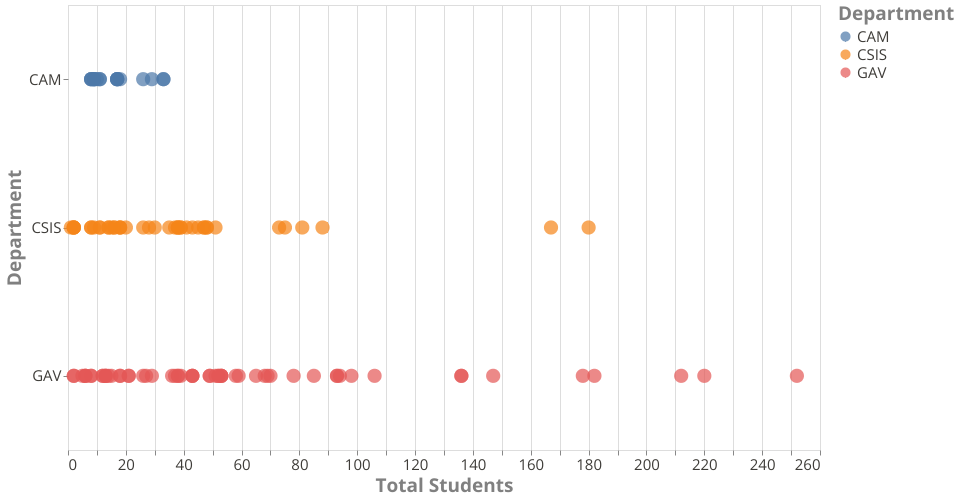
A scatter plot for New York Airbnb dataset using the vega-lite-api.
This visualization is designed to show the average price for different type of rooms in different neighbourhood of New York Area.
Each circle represents one type of room in a neighbourhood. The size of a circle represents the average number of review.
MIT Licensed