
0 views in last 90 days
KeerthiKandadai
@KeerthiKandadai
Public vizzes
Stage of Study(No of students in each Department)

Filterable Cocktail Ingredient Bar Chart
Project 10/31
Interactive Color Legend

Project 10/31
Total Disbursements Per Year by School
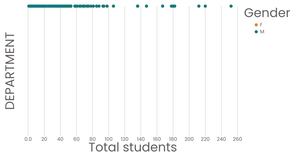
Student count for Each department
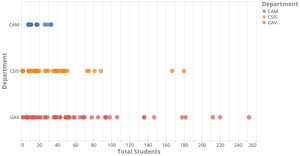
Student count for Each department
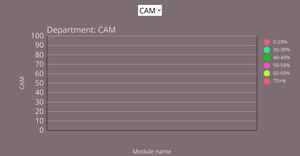
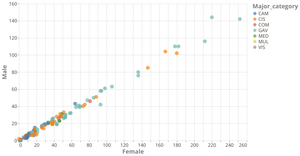
Student Performance Between Male & Female
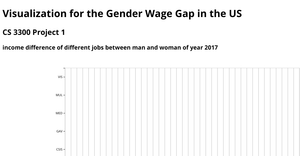
2017 Gender Wage Gap in the US
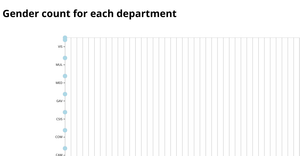
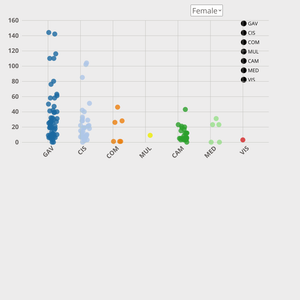
Gender count for each department
Scatter Plot with Small Points

Percentage distribution of social groups among States, 2007-08
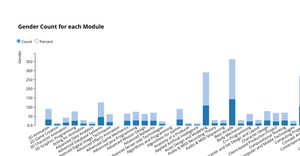
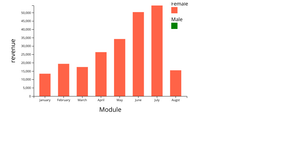
Gender Distribution Chart

Scatter Plot with Menu for ILINet Flu Surveillance Data

Untitled

Polished Scatter Plot with Menus

Multiple Line plot with Dropdown
1027Happiness Level Scatter Plot
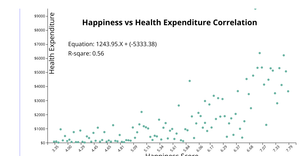
Linear Regression Line with D3.js

Plays over Time with Dropdown

Plays over Time with Dropdown
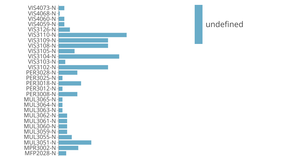
Tab.1(3)- Items of general project funding in 2018 (by nature of institutions)
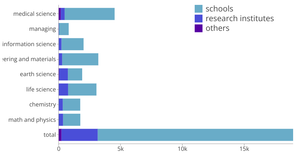
Tab.1(3)- Items of general project funding in 2018 (by nature of institutions)

Tab.1(3)- Items of general project funding in 2018 (by nature of institutions)

Student Performance Between Male & Female
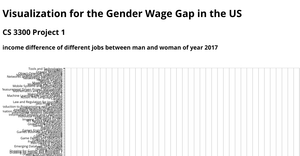
2017 Gender Wage Gap in the US

Suicide Trend over Years and Gender in United States

Suicide Trend over Years and Gender in United States

Filterable Cocktail Ingredient Bar Chart

Gender Distribution Chart
US Suicide from 1979 to 2015
Gender - Version 1.2
Stylized Bar Chart

Multiple Line plot with Dropdown
Stylized Bar Chart
Gender - Version 1.2
Gender - Version 1.2
Cocktail Ingredient Pairings

Cocktail Ingredient Pairings

Cocktail Ingredient Pairings

Gender Distribution Chart
d3 Updating Bar Chart With Dropdown
d3 Updating Bar Chart With Dropdown
Melting Data for Multiple Lines

Age Distribution Chart
Untitled

Untitled
Tooltip And Events Trial

Let's make a face with D3.js!
