🌍 Public
Fork of Portland Map
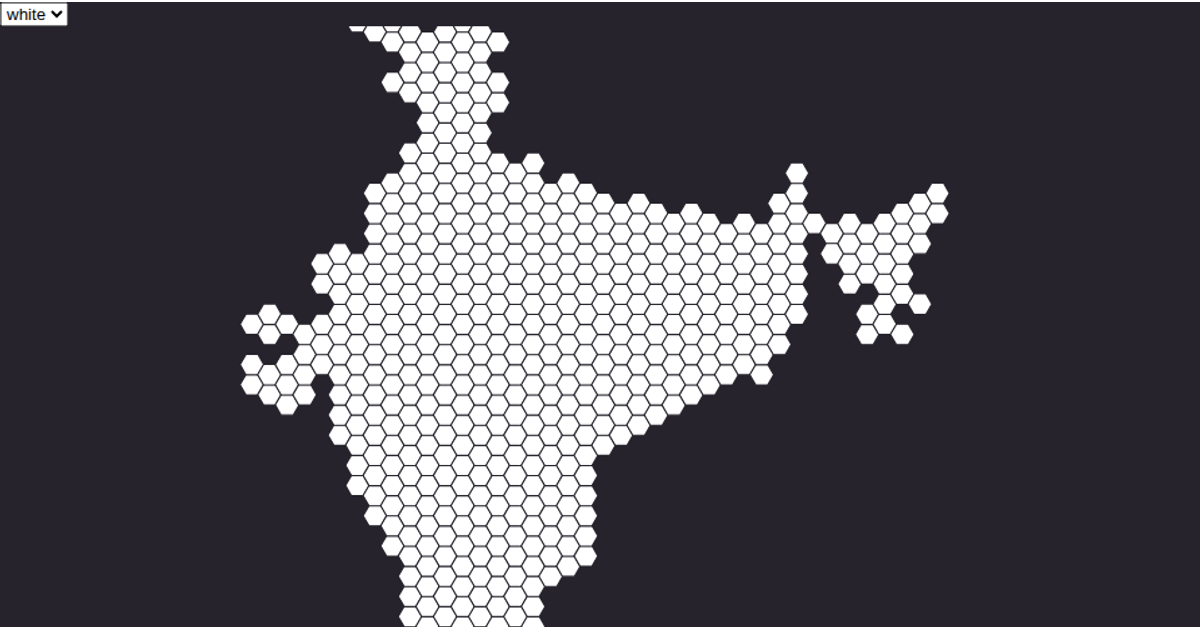
This visualization displays the neighborhoods of Portland as a collection of polygon outlines rendered in SVG. The map uses a conic equal-area projection configured with `d3.geoConicEqualArea` and `d3.geoPath` to draw each neighborhood boundary from the Data Canvas Sense Your City dataset. The React-based application loads TopoJSON data via a custom `useData` hook, converts it to GeoJSON with topojson’s `feature` function, and colors the shape edges pink against a clean white background.
AI-generated descriptionA scatter plot of Data Canvas Sense Your City Dataset.
MIT Licensed




Comments
Sign in to join the discussion.