Data: https://gist.github.com/Junying-Li/72ef4641efd6b4abf371f5d9f4267a56
What's new?
- Added scatter plot.
- Added brush (select year).
- Added legend for world map.
- Added tooltips for world map.
Todo:
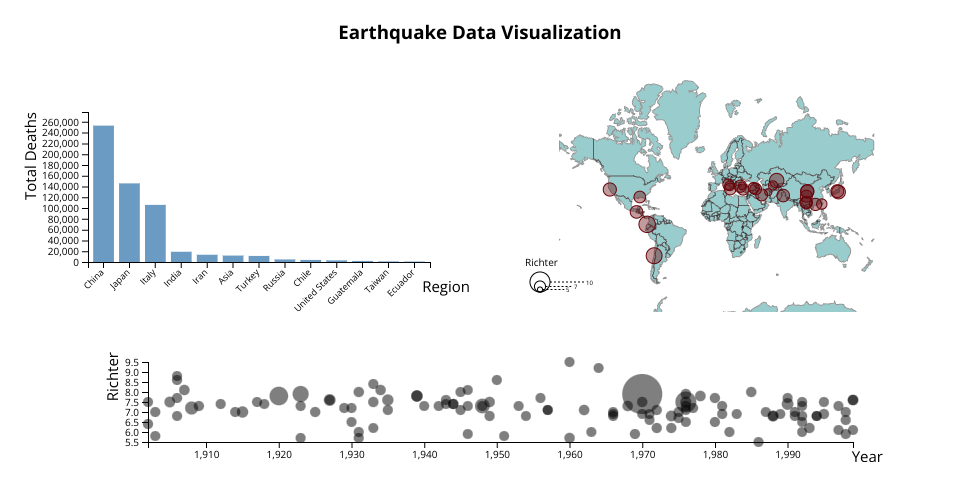
Bar plot:
X-axis: region that earthquake occured.
Y-axis: Deaths in earthquake.
World map:
Circle: positions where earthquake occured.
Radius: richter of earthquake.
Scatter plot:
X-axis: year.
Y-axis: richter of earthquake.
Radius: deaths of earthquake.
The bar plot shows the deaths caused by earchquakes in mutiple regions in different period of 19 century. The world map shows the positions where earthquakes occured and how strong they were (richter scale). The scatter plot shows richter and deaths of earthquakes in different years.
MIT Licensed