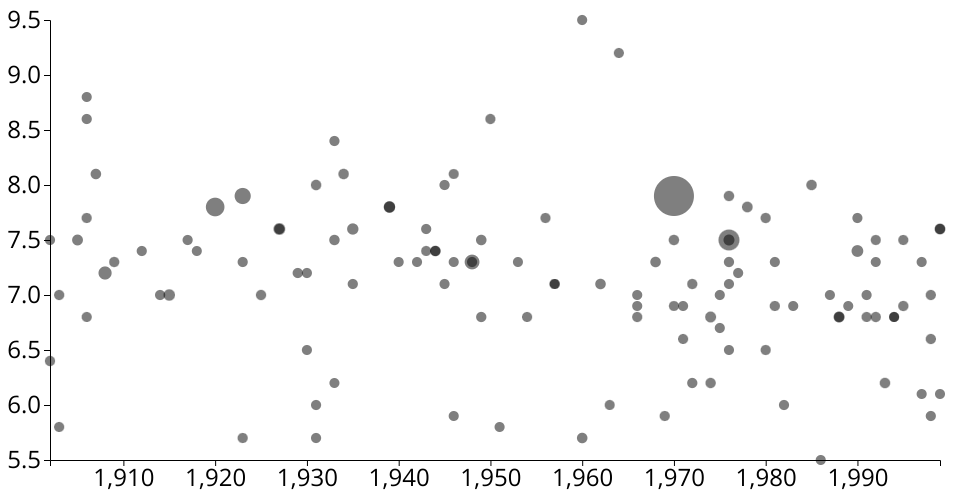
A D3 scatter plot shows the Richter of earthquakes occured from 1900 to 1999.
Brush:
- Select:
In selected area, circles become red.
- Double click:
If user has already selected an area, user can unselect it by double clicking in this area. If user has not selected area, double click will select all circles.
Data: Earthquakes Dataset.
Y-axis:
Richter of earthquakes
X-axis:
Timeline
Radius:
Deaths of earthquakes
MIT Licensed