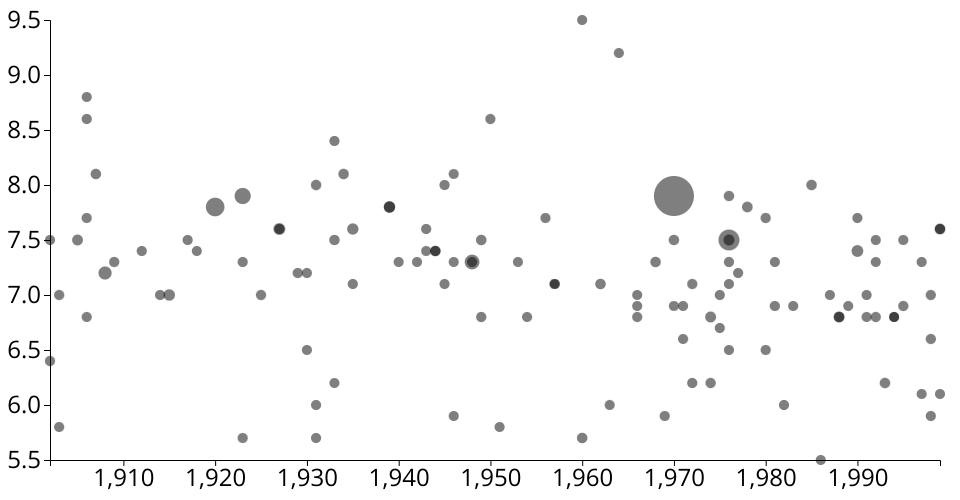
A D3 scatter plot shows the Richter of earthquakes occured from 1900 to 1999.
Data: Earthquakes Dataset.
Y-axis:
Richter of earthquakes
X-axis:
Timeline
Radius:
Deaths of earthquakes
MIT Licensed
A D3 scatter plot shows the Richter of earthquakes occured from 1900 to 1999.
Data: Earthquakes Dataset.
Richter of earthquakes
Timeline
Deaths of earthquakes