🌍 Public
Fork of Reusable D3 Scatter Plot - Colored Scatter
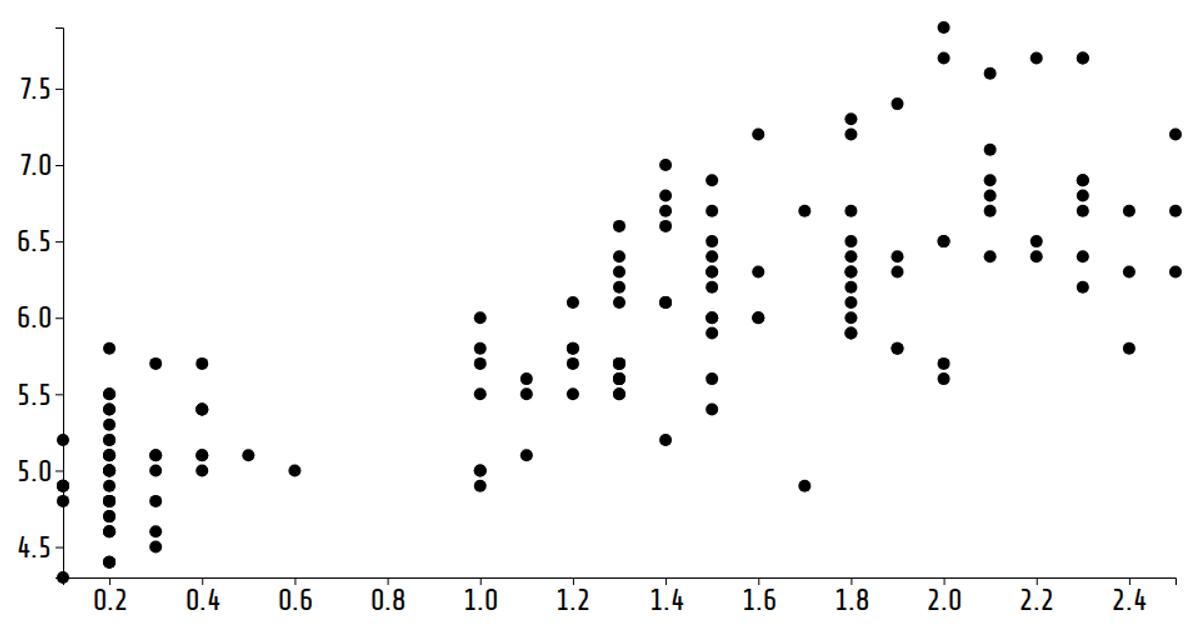
This example animates the Iris dataset, cycling through different feature-pair combinations on the x-axis every two seconds to reveal how flower species cluster across dimensions. The SVG scatter plot renders colored markers, with a separate set of marks distinguishing species by color and shape. It builds on a reusable `scatterPlot` module that uses `d3.scaleLinear`, `d3.axisLeft`, and `d3.axisBottom` to set up the axes, while `d3.csv` loads the data from a Gist. The animation is driven by JavaScript’s `setInterval`, updating the x-value accessor without redrawing the entire chart.
AI-generated descriptionMIT Licensed






Comments
Sign in to join the discussion.