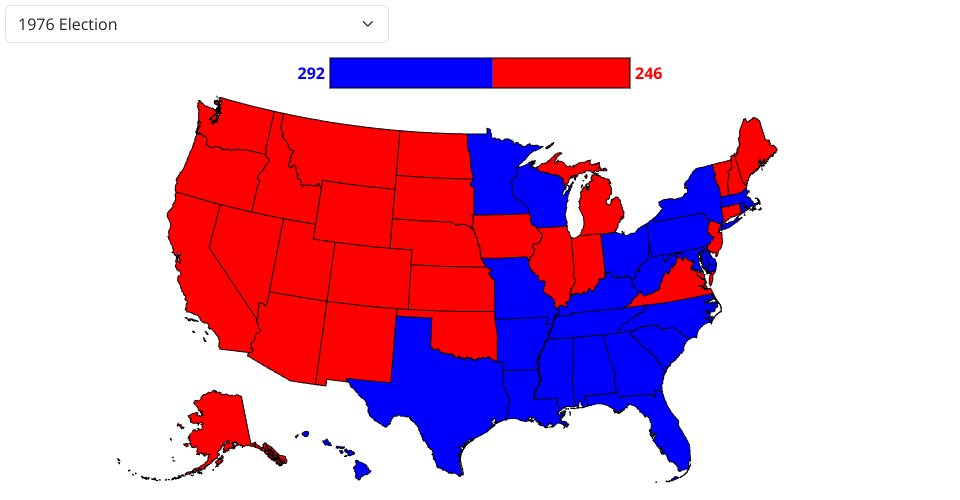
Visualization of US elections from 1976 to 2020.
Use the dropdown menu at the top to switch between elections. In the 'Custom' election, left click on a state to cycle it through Democratic, Republican, and Other control respectively.
Hover over a state in a non-custom visualization to view detailed information about the votes and parties in that state.
Right-click on a state to view a line chart showing the Democratic and Republican votes in that state over time. From this view, use the dropdown to return to the main map for a different election.
This visualization makes use of a publicly available US Elections Dataset.
Electoral vote counts by state are obtained from the National Archive.
This visualization adapts some of the VizHub templates by Curran Kelleher, in particular Axis Labels, Multi-Line Chart, and Simple Map.