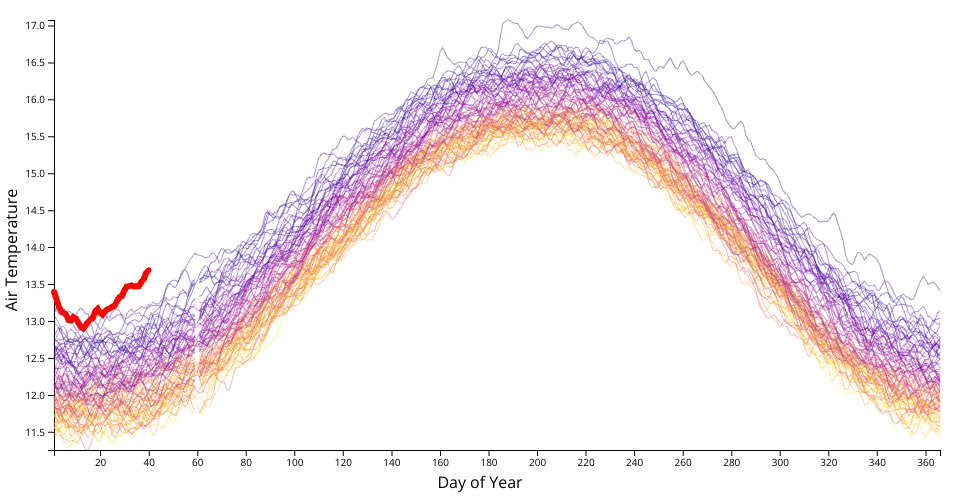
A visualization of Daily Surface Air Temperature, colored by year, with 2024 highlighted in red. Made in collaboration with EJ Fox, leveraging data prepared by Matthias Stahl.
MIT Licensed
A visualization of Daily Surface Air Temperature, colored by year, with 2024 highlighted in red. Made in collaboration with EJ Fox, leveraging data prepared by Matthias Stahl.