🌍 Public
Fork of Plot
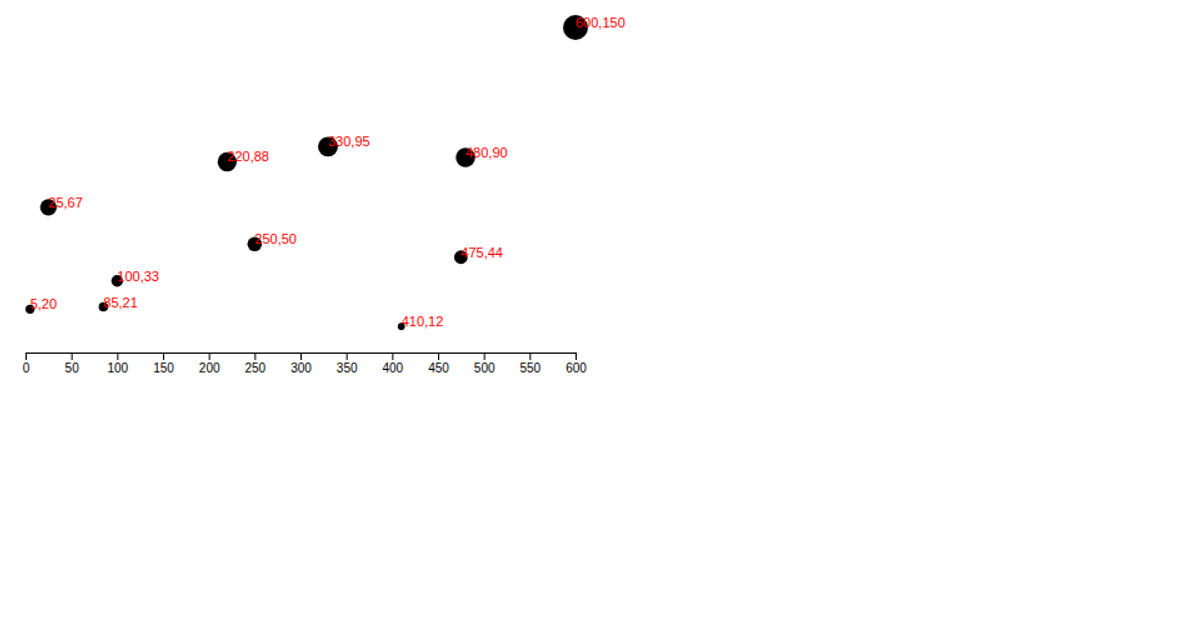
This scatter plot visualizes the relative positions of detected cones, with yellow and blue points plotted by their x and y coordinates. The visualization uses D3 v5 scales and SVG circles to map the data, with axes labeled based on the coordinate ranges. The code defines the data structure directly within the script and renders it using `scaleLinear`, `axisLeft`, and `axisBottom`, though the axes themselves are not appended to the SVG. The circles are styled with red fill and partial opacity from the CSS.
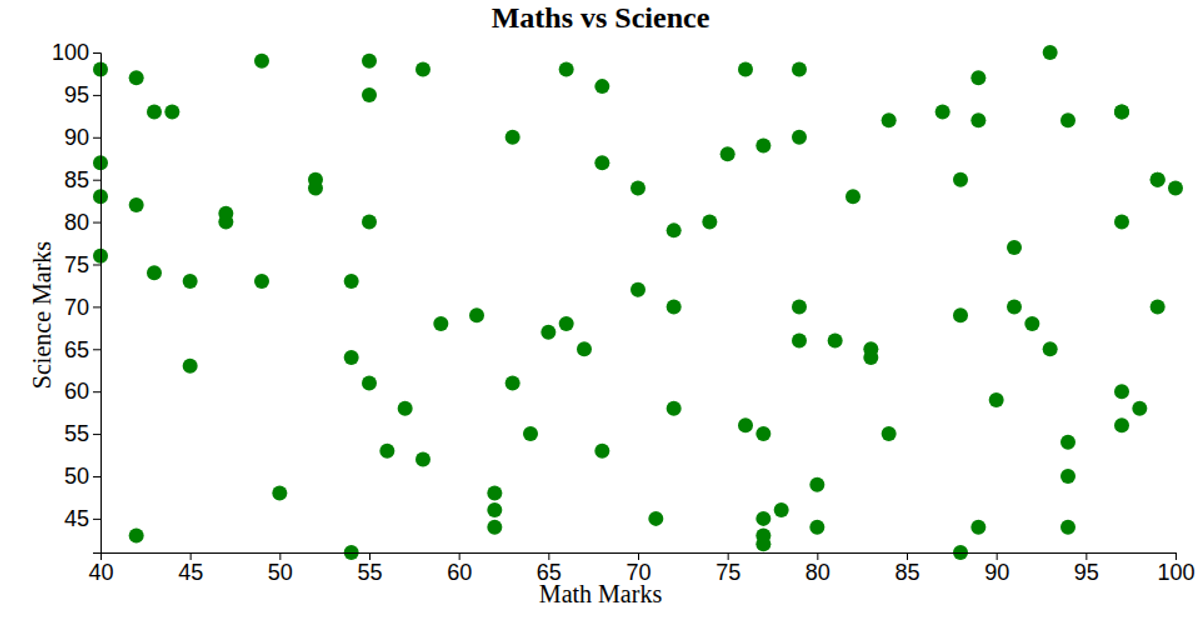
AI-generated descriptionThis scatter plot shows data about cars, from UCI Machine Learning Repository: Auto MPG Data Set.
MIT Licensed





Comments
Sign in to join the discussion.