🌍 Public
ICE 8
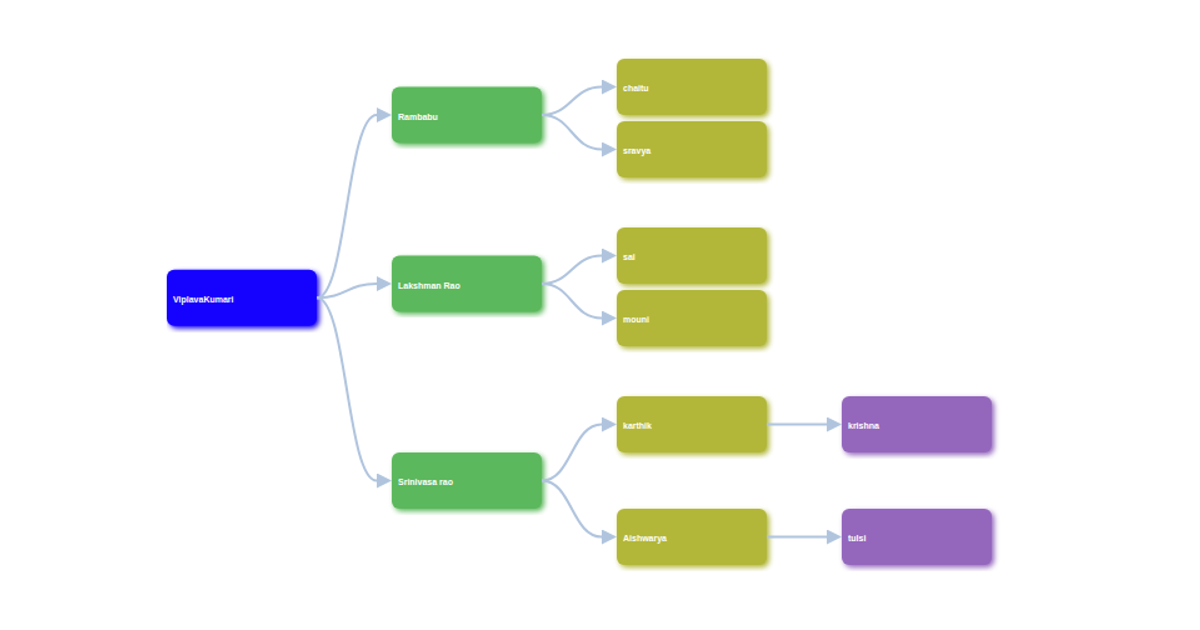
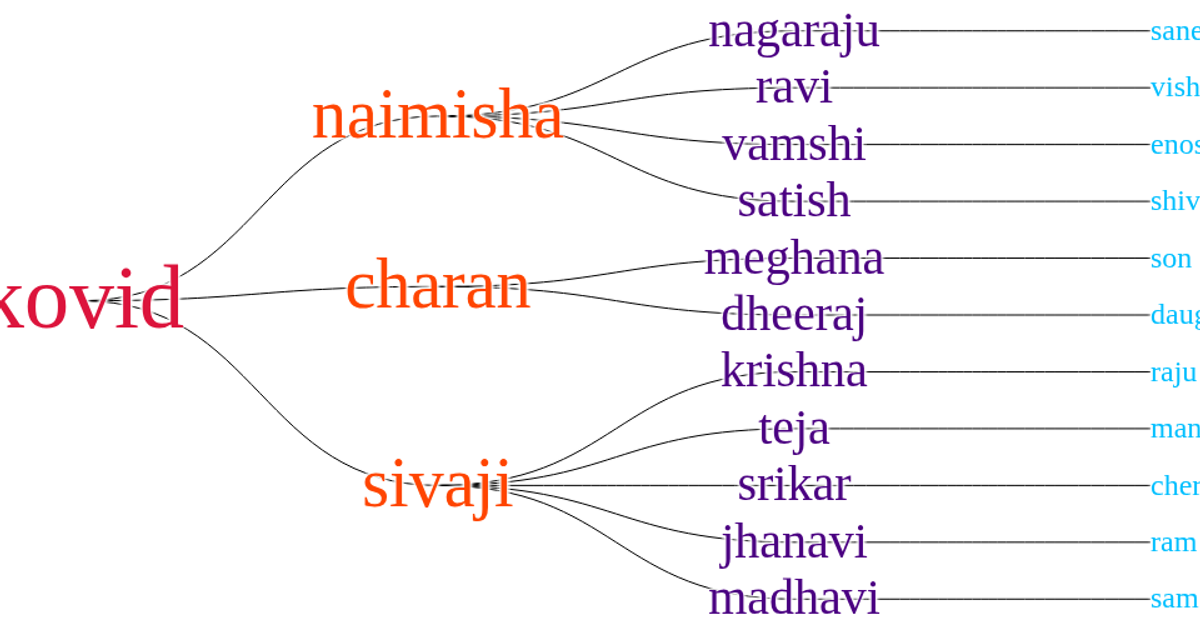
This interactive family tree visualization displays a hierarchical dataset showing Marco, his children Martin and Jhon, and their descendants. Users can click any node to collapse or expand its subtree, with smooth 750-millisecond transitions animating the layout changes. The visualization uses the D3.js library, specifically the `d3.layout.tree` for computing the tree structure, `d3.svg.diagonal` for drawing curved links between nodes, and SVG elements with CSS styling for rendering. Node positions are normalized by depth, and circles indicate expandable nodes when filled with lightsteelblue.
AI-generated descriptionMIT Licensed



Comments
Sign in to join the discussion.