🌍 Public
Fork of Stylized Bar Chart
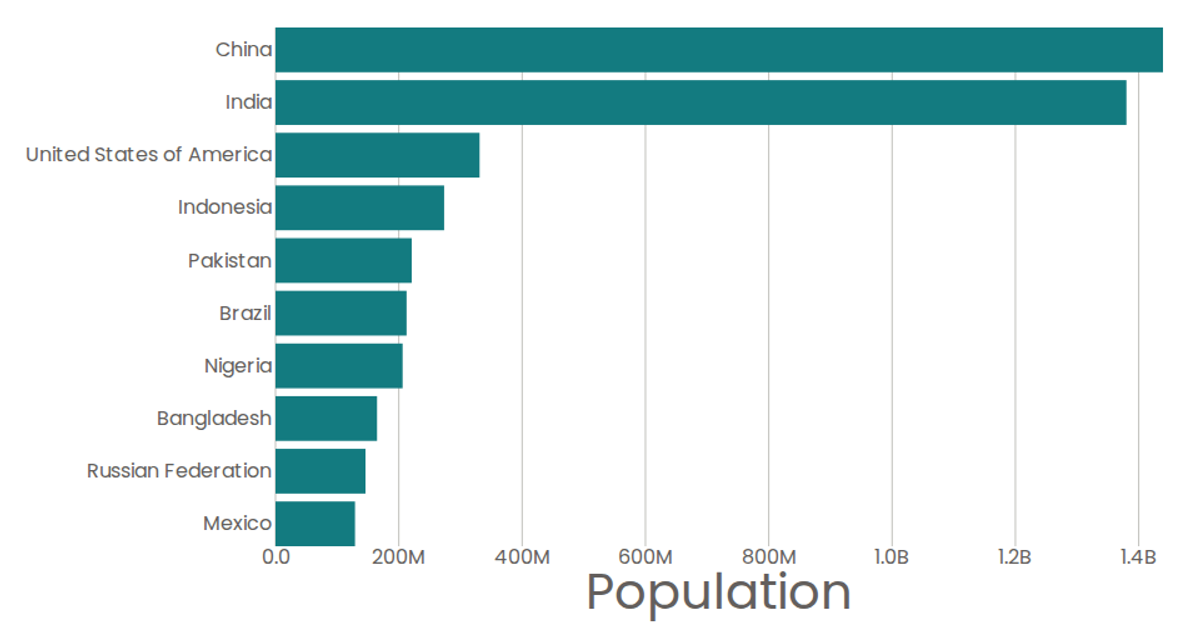
This bar chart displays the top three most populous countries—China, USA, and India—using horizontal bars scaled by population (in millions). Built with React and D3 v5, it uses `scaleBand` for the categorical y-axis and `scaleLinear` for the numeric x-axis, rendering SVG rectangles via the `Marks` component. Population values are formatted with D3’s `format` function to abbreviate large numbers (e.g., “12.06B”), and styled with red fills and Poppins font. Data comes from a local CSV file, with axes drawn through custom `AxisBottom` and `AxisLeft` components.
AI-generated descriptionA program that shows the top 10 most populous countries as a bar chart.
MIT Licensed





Comments
Sign in to join the discussion.