🌍 Public
GItHub repo starter for Scatter Plot for Efficient Frontier
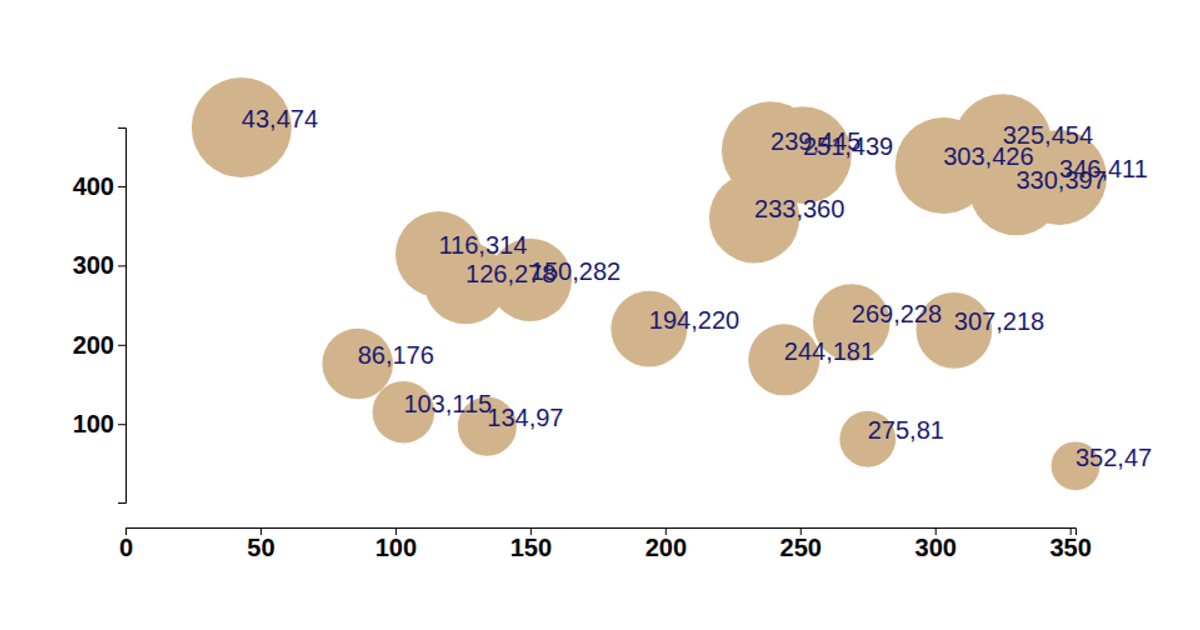
This example demonstrates a scatter plot of randomly generated data points, representing a simplified efficient frontier visualization. The chart displays each data pair as a circle whose size and opacity scale with its y-value, alongside its coordinate labels. Built with D3 version 6, the code uses `d3.select`, `d3.scaleLinear`, `d3.axisBottom`, and `d3.axisLeft` to render the SVG output. A linked GitHub repository and YouTube tutorial provide context for extending the starter project.
AI-generated descriptionA demonstration of how to start using D3 version 6.
MIT Licensed







Comments
Sign in to join the discussion.