React D3 Scatterplot Visualization
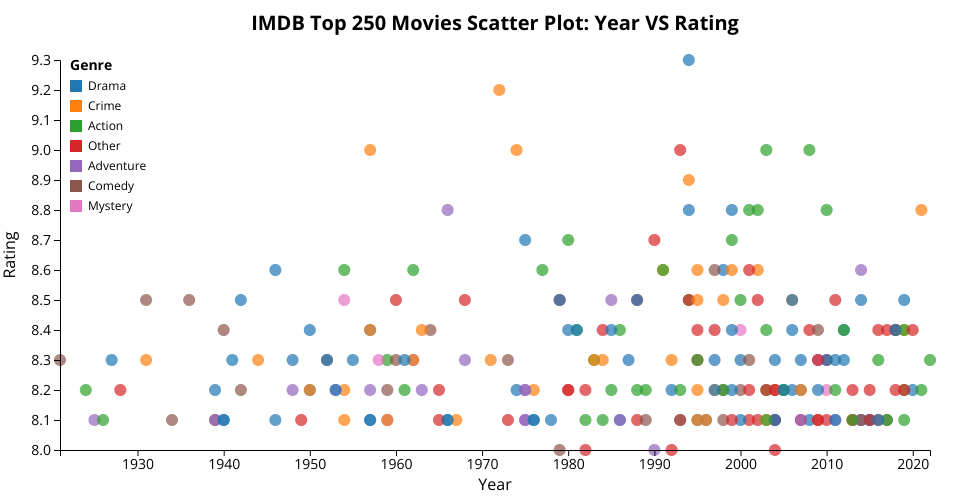
This project creates a scatterplot visualization using React and D3. It displays movies data with year on the x-axis and rating on the y-axis, with each point colored by genre.
Features
- Scatterplot with axes
- Color-coded genres (Top 6 genres + Other)
- Legend showing genre colors
- Responsive design
Data
The visualization uses data from data.csv which contains
information about popular movies including:
- Year of release
- Movie rating
- Genre (processed to show only top 6 most frequent genres, others grouped as "Other")
MIT Licensed