🌍 Public
making a barchart
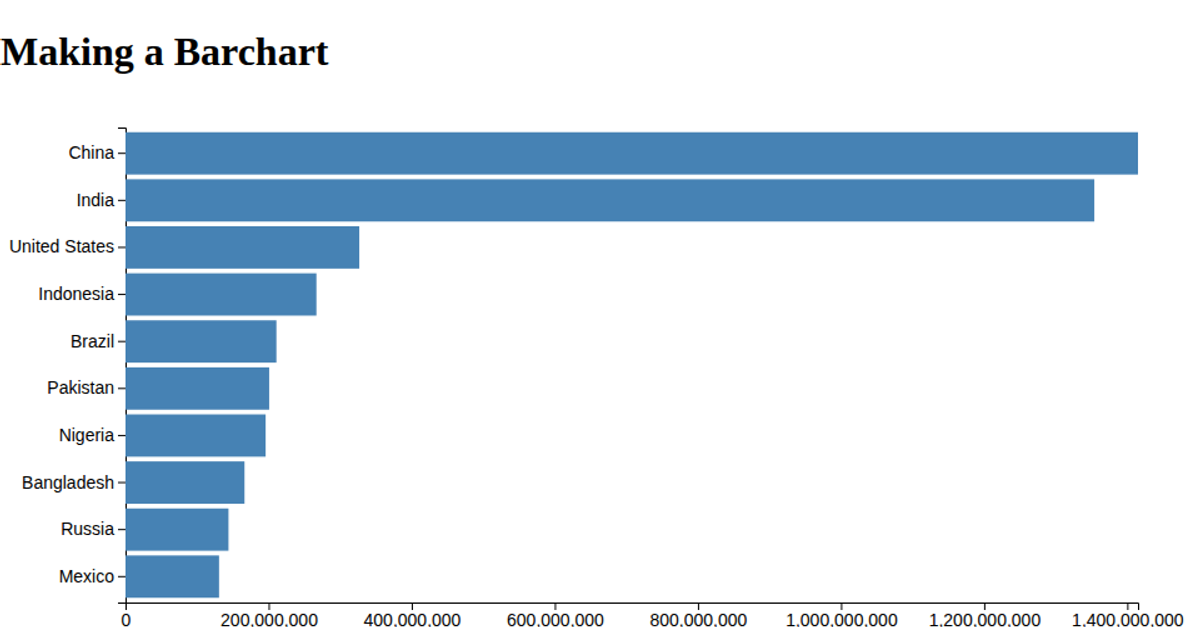
This example shows a simple bar chart built with D3 v7, displaying population counts for seven countries from a CSV file. The code loads data with `d3.csv`, converts the population strings to numbers, and appends SVG rectangles for each data row. It uses `scaleLinear` to create an x-scale, though the rectangles are given fixed dimensions of 300 by 300 pixels rather than being sized by the data values. The visualization renders entirely in SVG within a 960-by-500 pixel canvas.
AI-generated descriptionMIT Licensed


Comments
Sign in to join the discussion.