🌍 Public
Fork of Vega-Lite API Template3
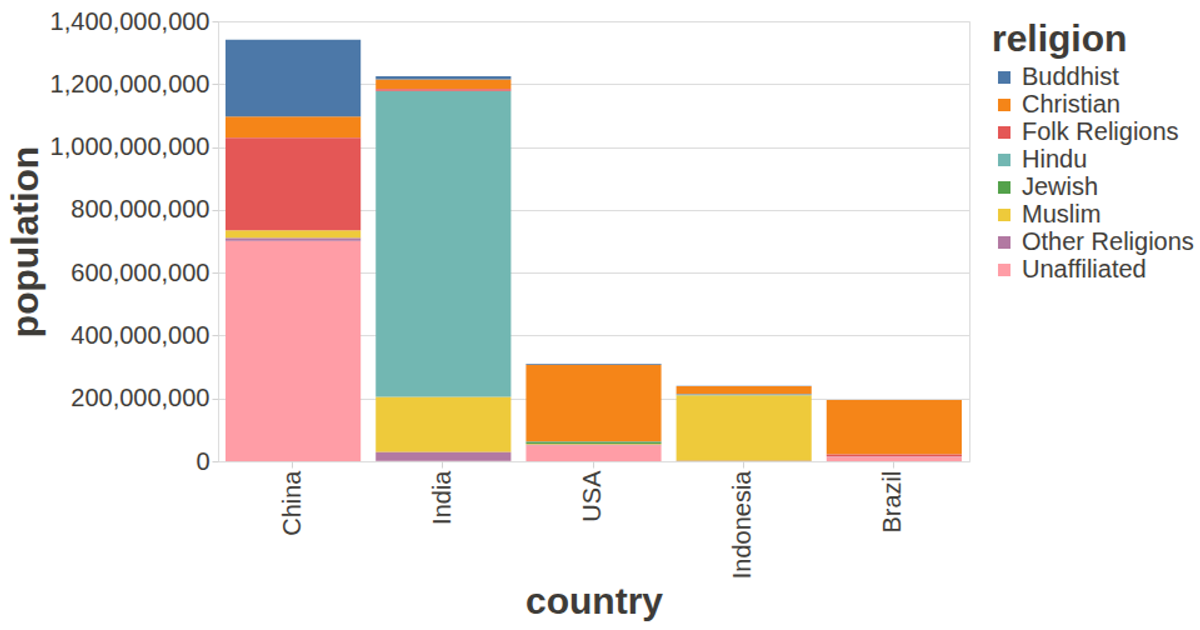
This visualization shows a bar chart of population by country, sorted in descending order, with tooltips displaying the raw population values on hover. It uses the Vega-Lite API to define the chart specification, while D3.js loads the CSV data from a Gist. The rendering pipeline combines Vega, Vega-Lite, and Vega-Lite API libraries, with Vega-Tooltip for interactive hover details. The chart is configured to fit the full browser window and uses custom axis styling for improved readability. Data originates from the UCI Machine Learning Repository’s Auto MPG dataset.
AI-generated descriptionA visualization constructed using the vega-lite-api.
The data shown here comes from the UCI Machine Learning Repository: Auto MPG Data Set, via Gist: Scatter Plot with Menus.
MIT Licensed



Comments
Sign in to join the discussion.