🌍 Public
ICE8 map
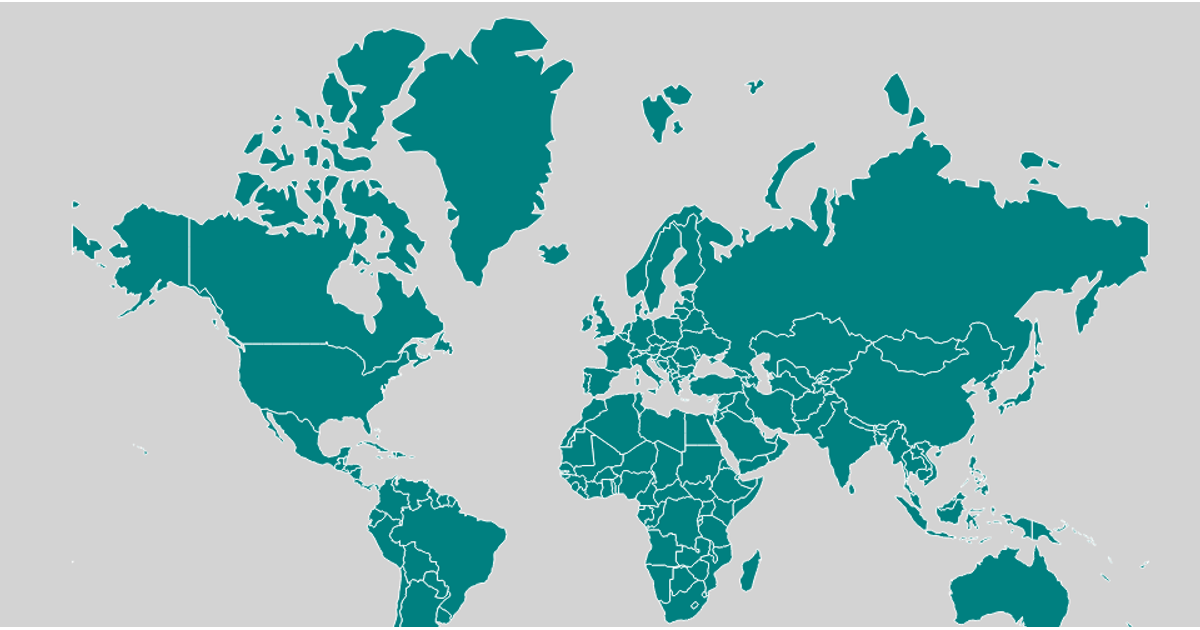
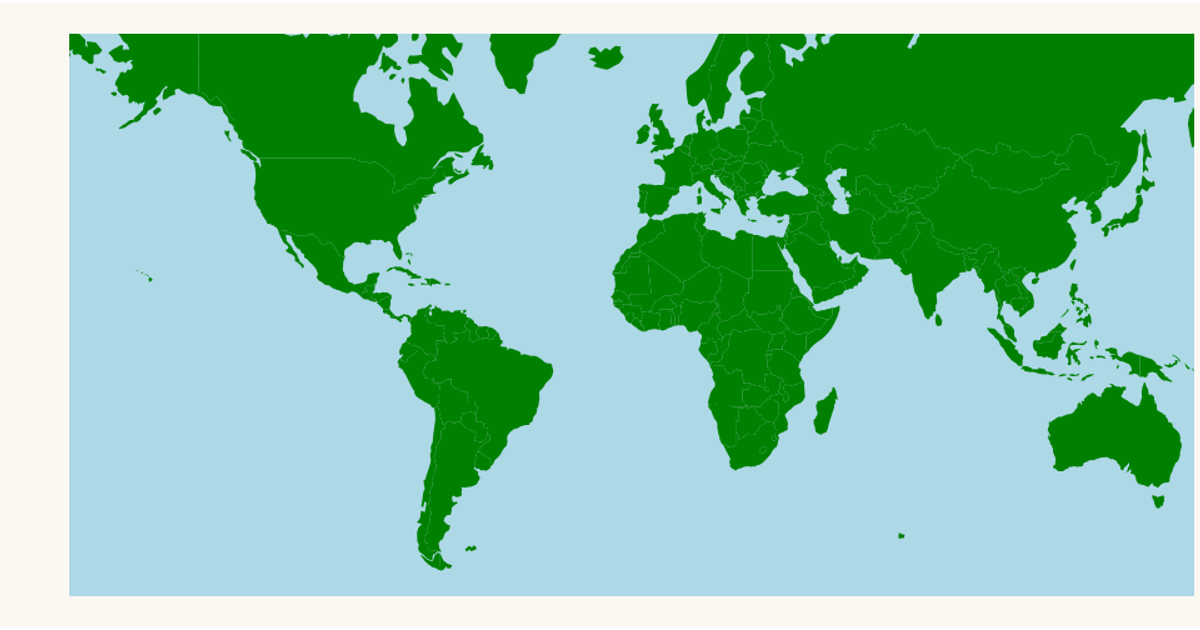
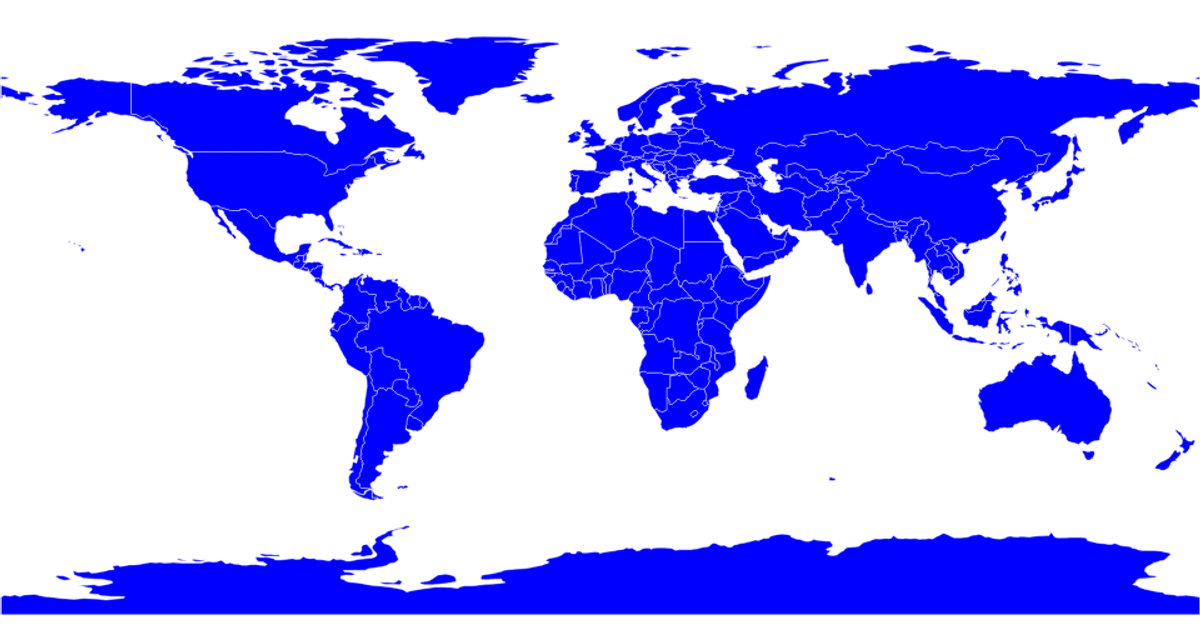
This visualization displays a world map using a Mercator projection, with each country rendered as an SVG path. It uses d3.geoMercator and d3.geoPath to project geographic coordinates, with TopoJSON data from the world-atlas package providing country boundaries. The map applies a brown fill with semi-transparent black strokes, and the page has a light blue background.
AI-generated descriptionMIT Licensed





Comments
Sign in to join the discussion.