🌍 Public
Fork of ICE 7question 3 Line Chart
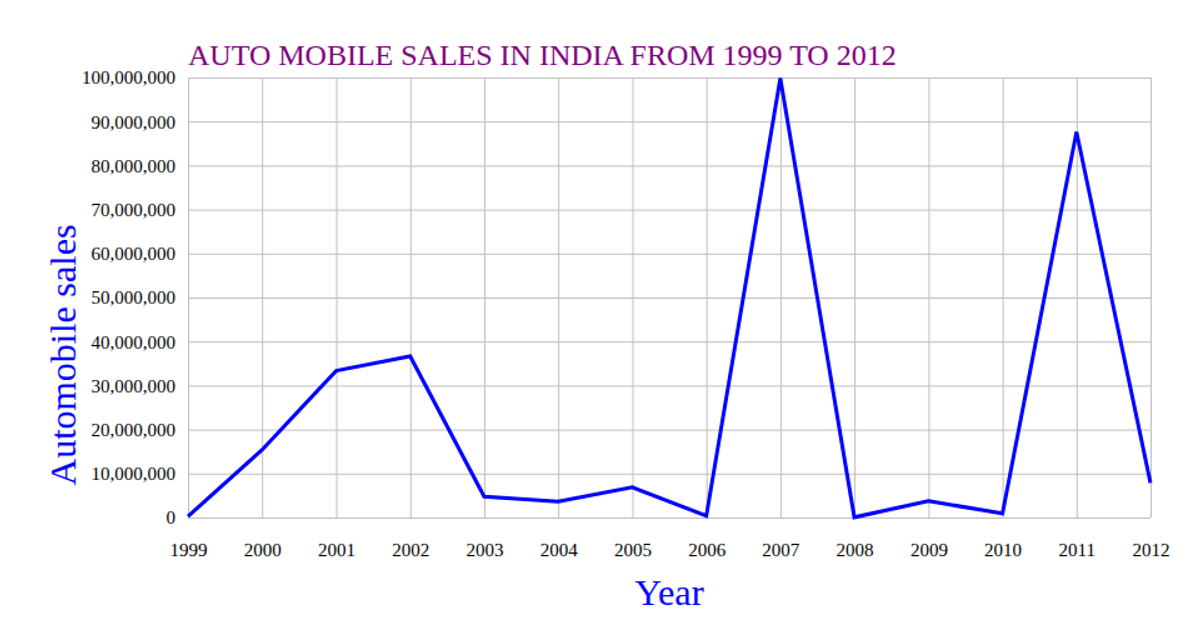
This line chart visualizes automobile sales in India from 1999 to 2012, plotting quarterly data for a competitor against time. The SVG rendering uses d3.scaleTime and d3.scaleLinear to map quarter and sales values, with d3.axisBottom and d3.axisLeft creating labeled axes with gridlines. Data loads from a CSV via d3.csv, and the line path is generated using d3.line. The chart highlights sales trends with a styled blue stroke and includes a purple title.
AI-generated descriptionMIT Licensed




Comments
Sign in to join the discussion.