🌍 Public
test
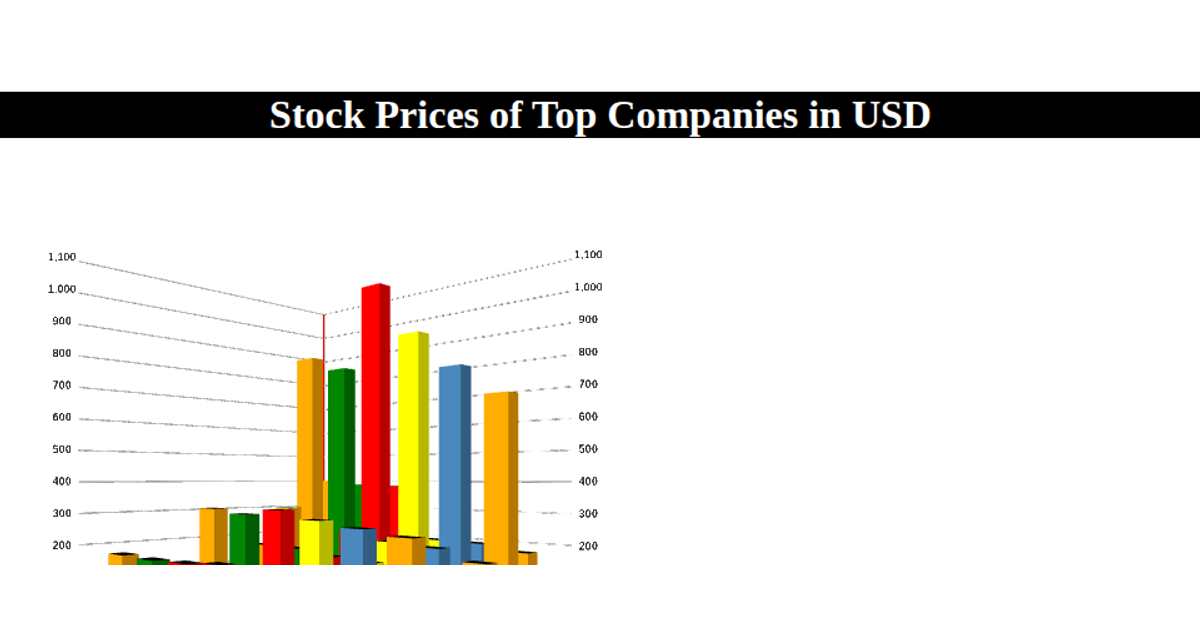
This example shows a bar chart tracking net premiums for a single company across years, with time on the x-axis and premium values on the y-axis. The visualization uses React for component structure and state management, while D3 v7 handles the SVG rendering, scales, and axes. The `useData` hook loads the CSV data, and `VizWrapper` creates the SVG canvas before calling the `viz` function, which uses `scaleLinear` and `extent` to map data to coordinates. The bars are drawn using D3 selections with `selectAll` and `join`.
AI-generated descriptionThis viz is a starter that demonstrates patterns used in real world projects in which complexity is anticipated to scale.
- Decoupled React & D3 integration
- Opening moves for scalable complexity
- Industry standard ES modules and JSX
- Copy-paste into existing projects
Any questions? Ask on Twitter!
Also viewable in:
MIT Licensed




Comments
Sign in to join the discussion.