🌍 Public
Mapspointsjs!
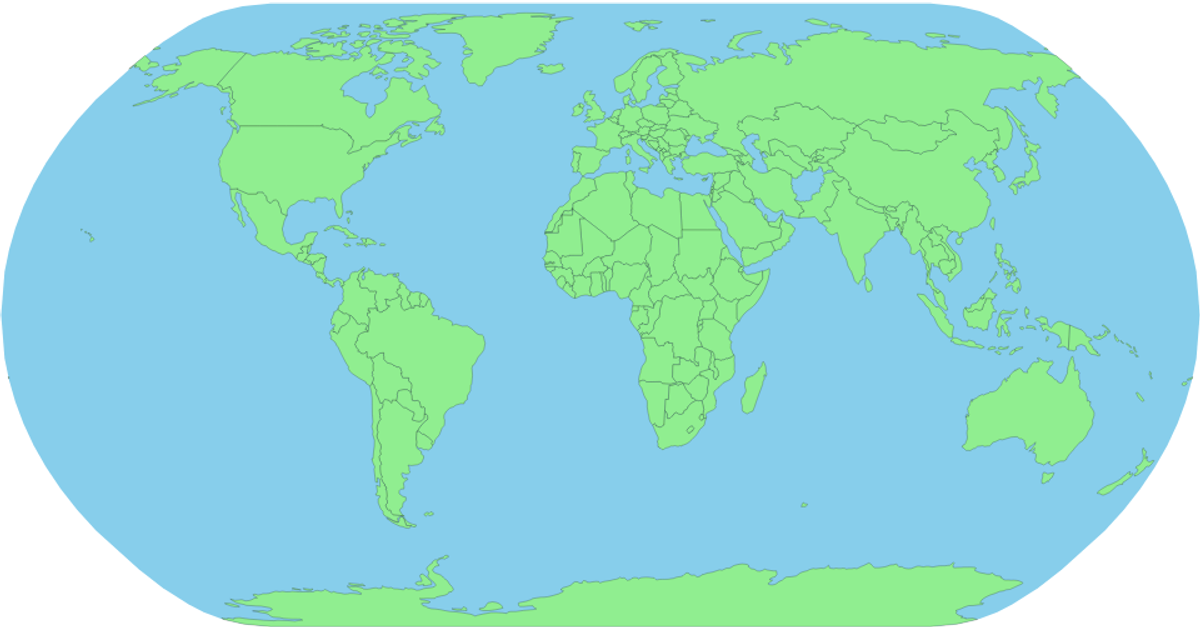
This example displays a world map using SVG paths, with each country filled in white and outlined in black. Hovering over a country highlights it in red and reveals its name in a tooltip. The map is built with D3’s `geoPath` and `geoNaturalEarth1` projections to render geographic features, while the `topojson` library processes the country boundaries from a remote TopoJSON source. All rendering occurs client-side in SVG, with interaction handled through CSS hover states and D3’s `select` and `json` functions.
AI-generated descriptionAn example showing the capabilities of VizHub:
- Loads D3 via UNPKG.
- Demonstrates use of
importfrom"d3". - Demonstrates use of
importfrom local ES6 modules.
MIT Licensed


Comments
Sign in to join the discussion.