🌍 Public
Menus Scatter Plot
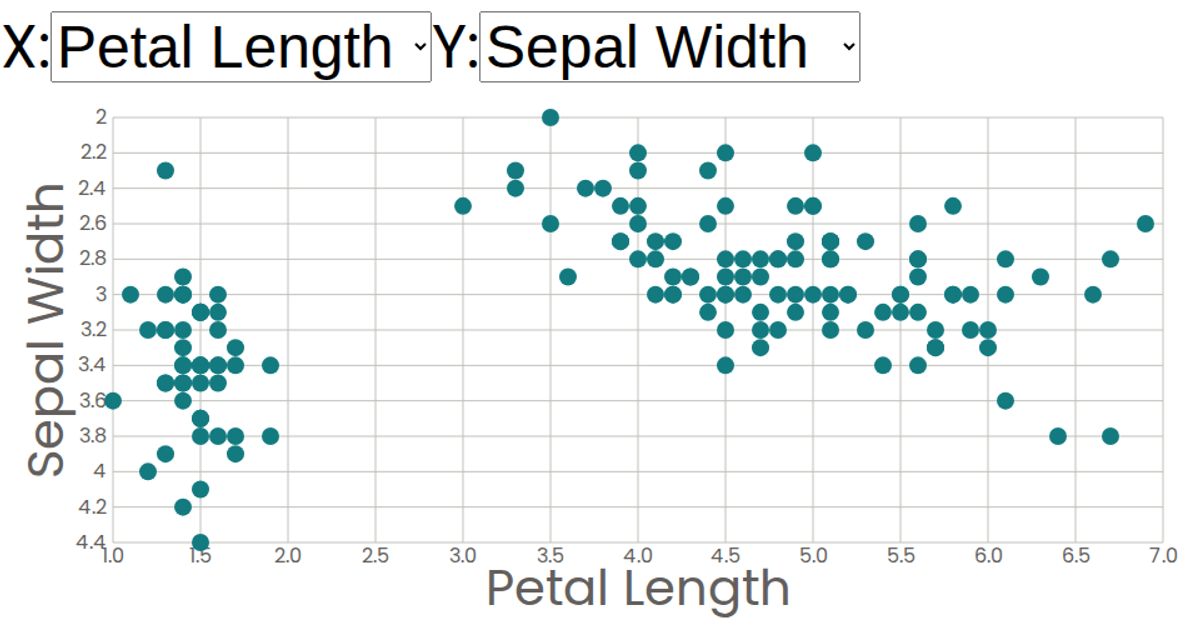
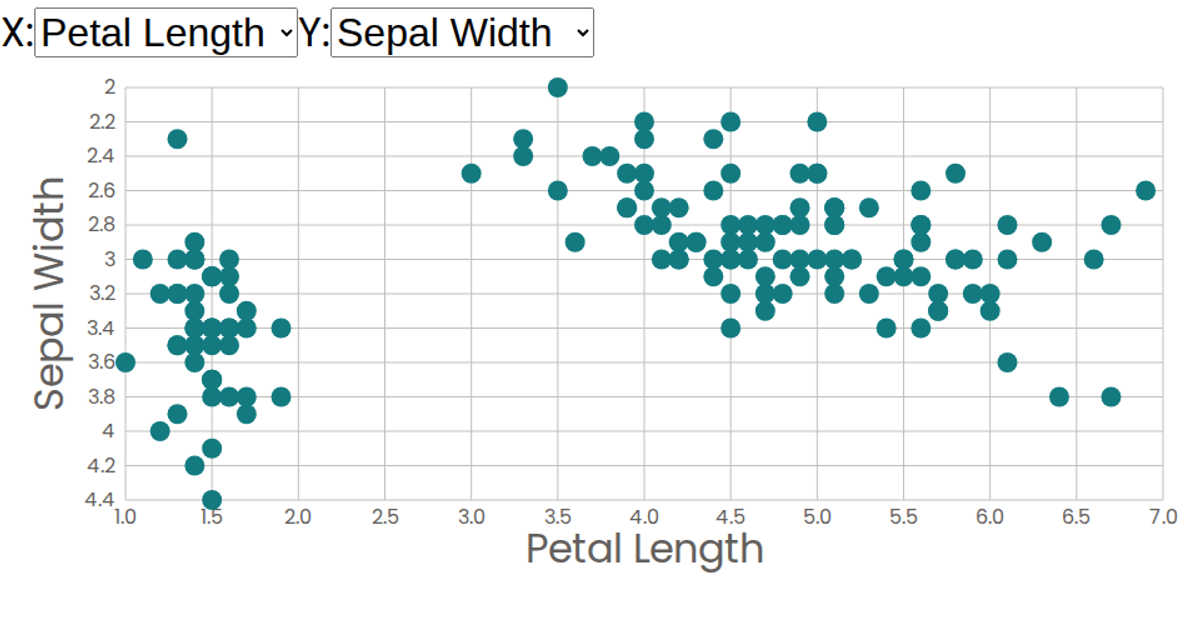
An interactive scatter plot of the Iris flower dataset, showing relationships between sepal and petal measurements. Two dropdown menus let viewers select which attributes map to the x and y axes. The visualization uses React with D3’s `scaleLinear` and `extent` for scaling, and renders SVG circles via the `Marks` component. Data is loaded asynchronously with D3’s `csv` fetching from a GitHub gist, with axes generated by custom `AxisBottom` and `AxisLeft` components.
AI-generated descriptionA bare minimum HTML page demonstrating use of CSS and JavaScript.
See also React Starter.
MIT Licensed




Comments
Sign in to join the discussion.