Resources
Contact
Pricing
🇺🇸
EN
Log in
Open Editor
Revision History
Export Image
Share
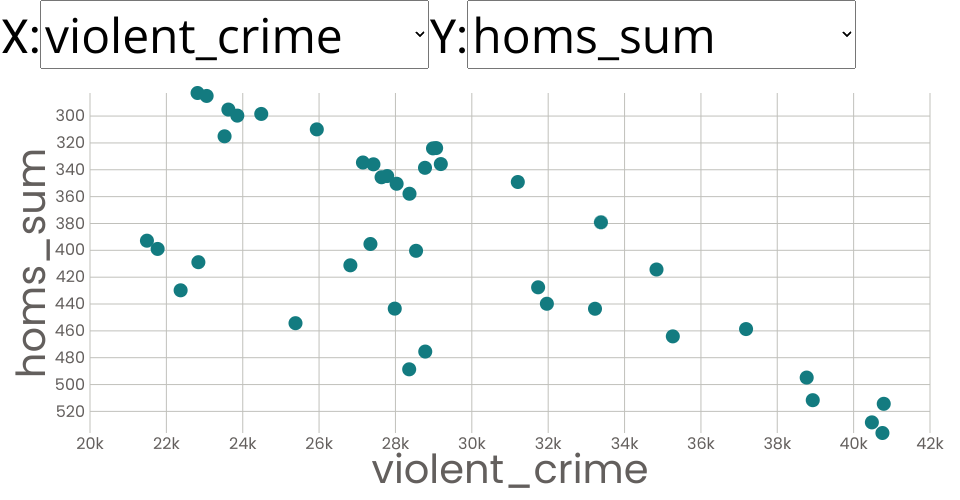
Scatter Plot with Menus
1
Fork
0
Likes
yyaaa1
0 views in last 90 days
Last edited Oct 24, 2019
Created on Oct 24, 2019
Forked from
Scatter Plot with Menus
uses
v2 runtime
A visualization for
U.S. Metro Areas Violent Crime Rates by Type
MIT Licensed