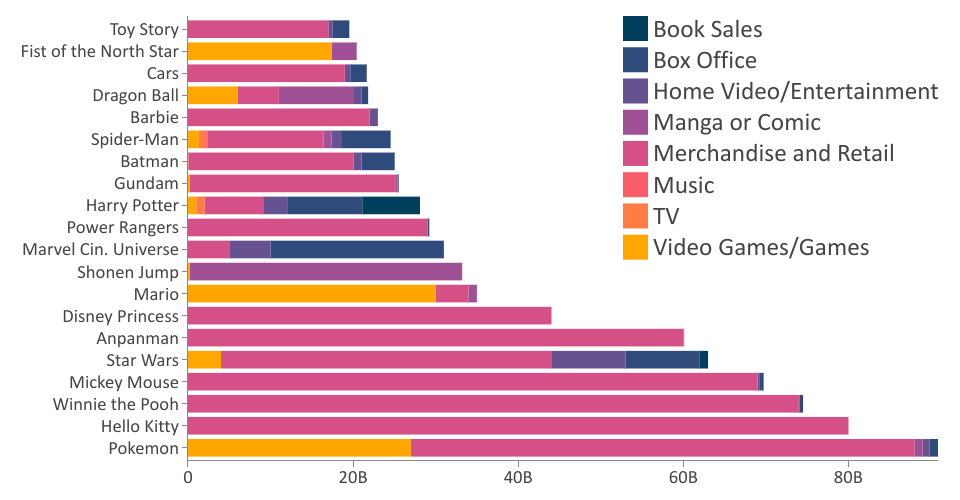
This visualization was originally forked from one of Curran Kelleher's stacked bar chart examples and modified to include Franchise Revenue data which originates from R for Data Science's Tidy Tuesday weekly event for July 2, 2019.
This visualization serves as a companion chart to the previous scatter plot, contrasting its view with a stacked bar chart and a legend with interactive highlighting. The next goal is to combine the two visualizations, their styles, and their techniques into one cohesive view.
MIT Licensed