A visualization constructed using the vega-lite-api taking advantage of the markPoint function and the separation of data by color.
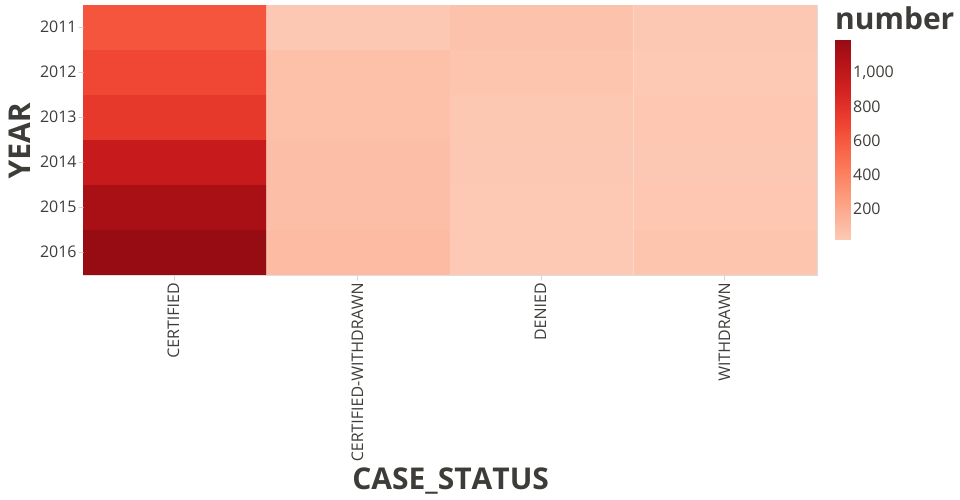
A program that shows the number of different case status for each year with D3&React.
Data: immigration programs data from The Office of Foreign Labor Certification (OFLC).
MIT Licensed