Description:
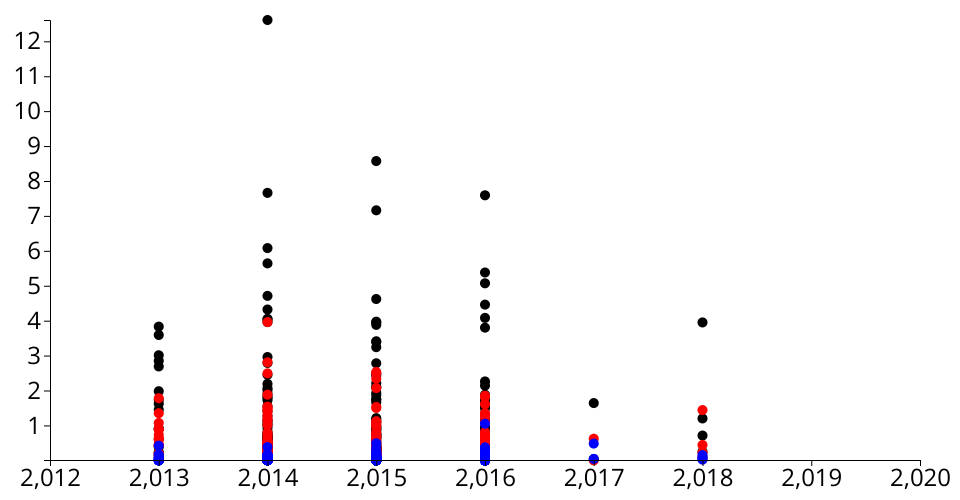
The scatter plot visualizes the PS4 Game Sales Dataset. It is designed to compare the number of sales in each area from 2013 to 2018.
Representations:
- X-axis: Year of release.
- Y-axis: Sales in million.
- Dots: Each dot represents a PS4 game. The colors distinguish the sales in different areas:
- Black color represents global sales.
- Red color represents sales in North America.
- Blue color represents sales in Japan.
MIT Licensed