This visualization was constructed using the vega-lite-api. It was originally forked from one of Curran Kelleher's Vega-Lite API templates and modified to include Franchise Revenue data which originates from R for Data Science's Tidy Tuesday weekly event for July 2, 2019.
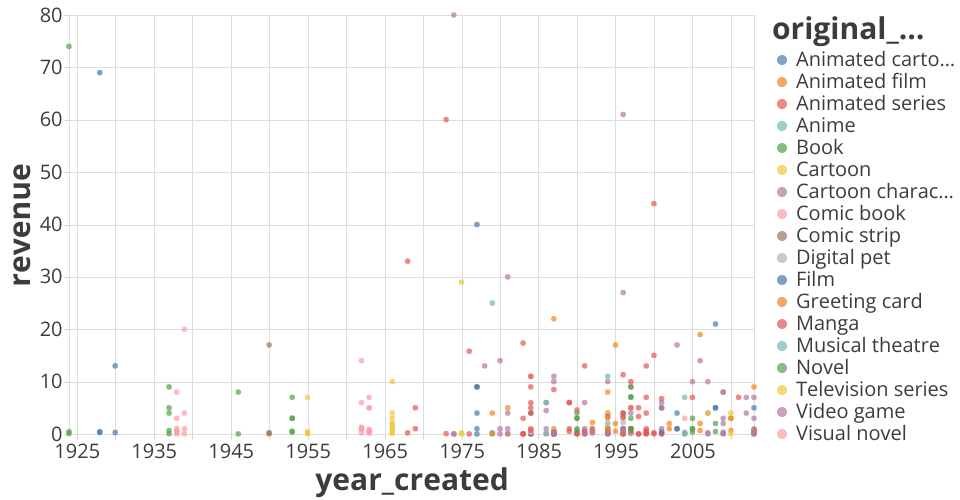
This chart shows Revenue Stream by Year Created. My goal was to see how revenue compares to the year the franchise was created, and the coloration shows the franchise's original media type to see if any obvious connections can be found. Each data point corresponds to a franchise's category. More identifying information is available by tooltip.
The outliers are quite interesting. Hello Kitty merchandise is the highest. Disney Princess merchandise and Pokémon merchandise are both quite high despite their relatively younger age.
Ultimately, I don't think this view is as helpful as others, but it's a good launching point for different visualization angles.