🌍 Public
turinBudget
FFedericopvs
Last edited Feb 24, 2016
Created on Feb 19, 2016
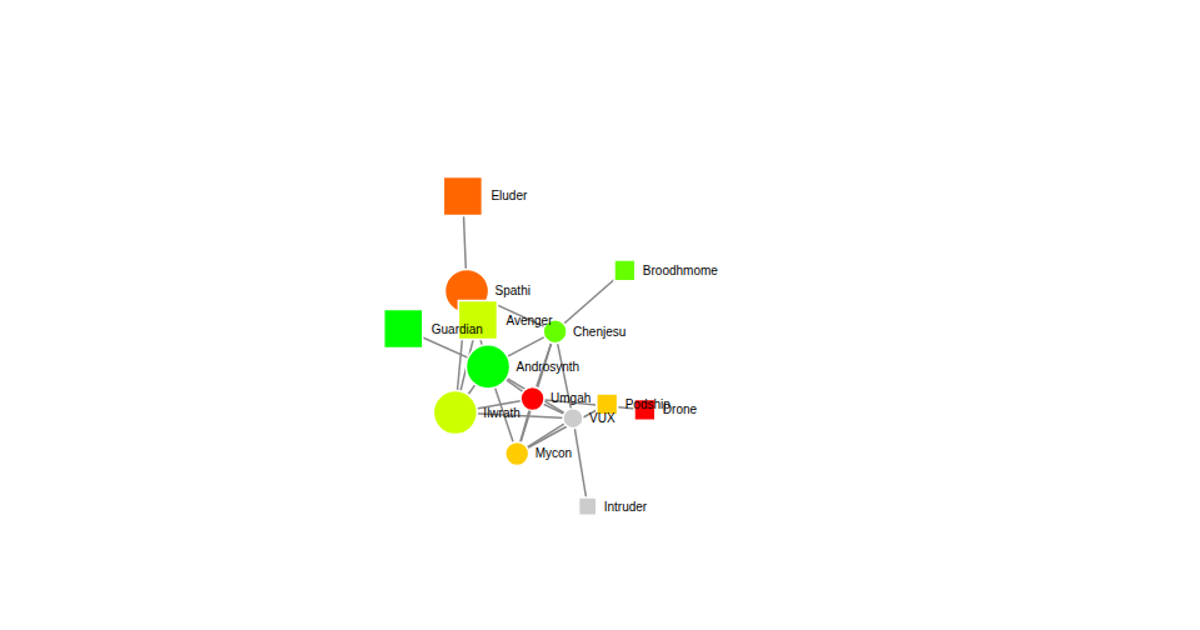
A force-directed network diagram maps the interconnected structure of Turin’s municipal budget, with circular nodes representing administrative departments and animated links indicating financial flows between them. Rendered in SVG with D3.js, the layout uses physics simulation to arrange nodes by spending relationships, while hover interactions highlight budget allocations.
AI-generated descriptionBSD-2-Clause Licensed




Comments
Sign in to join the discussion.