Focus + Context Scatter Plots
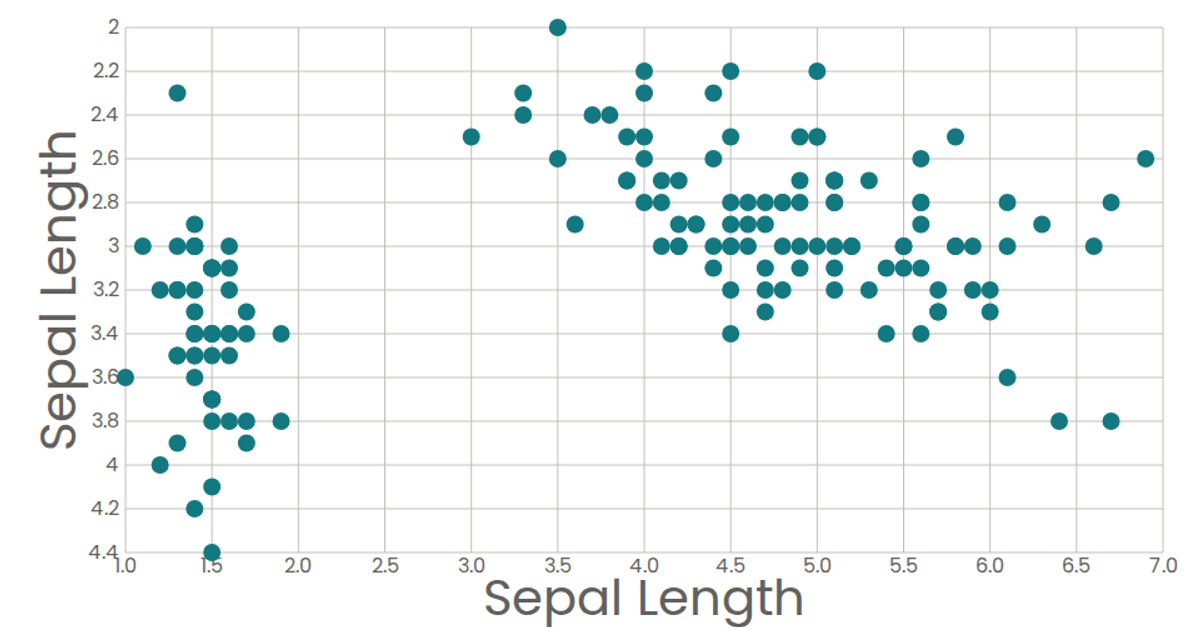
This example demonstrates focus + context scatter plots using the classic Iris dataset, showing sepal length versus petal length. Two coordinated scatter plots are arranged side by side—a small context view with a draggable brush and a larger focus view that zooms into the brushed region. Built with Chiasm and D3.js, the visualization uses reactive data bindings to synchronize the brush intervals with the focus plot’s scale domains. The custom scatter plot component leverages D3 scales, SVG circles, and a brush overlay to enable interactive filtering of the data points.
AI-generated descriptionFocus + Context Scatter Plots using Chiasm.
Draws from
<!-- Start of SimpleHitCounter Code --> <div align="center"><a href="http://www.simplehitcounter.com" target="_blank"><img src="http://simplehitcounter.com/hit.php?uid=1950330&f=16777215&b=0" border="0" height="18" width="83" alt="web counter"></a></div> <!-- End of SimpleHitCounter Code -->forked from <a href='http://bl.ocks.org/curran/'>curran</a>'s block: <a href='http://bl.ocks.org/curran/d1e9ea2850047562be09'>Focus + Context Scatter Plots</a>




Comments
Sign in to join the discussion.