🌍 Public
Fork of AIDS distribution Choropleth
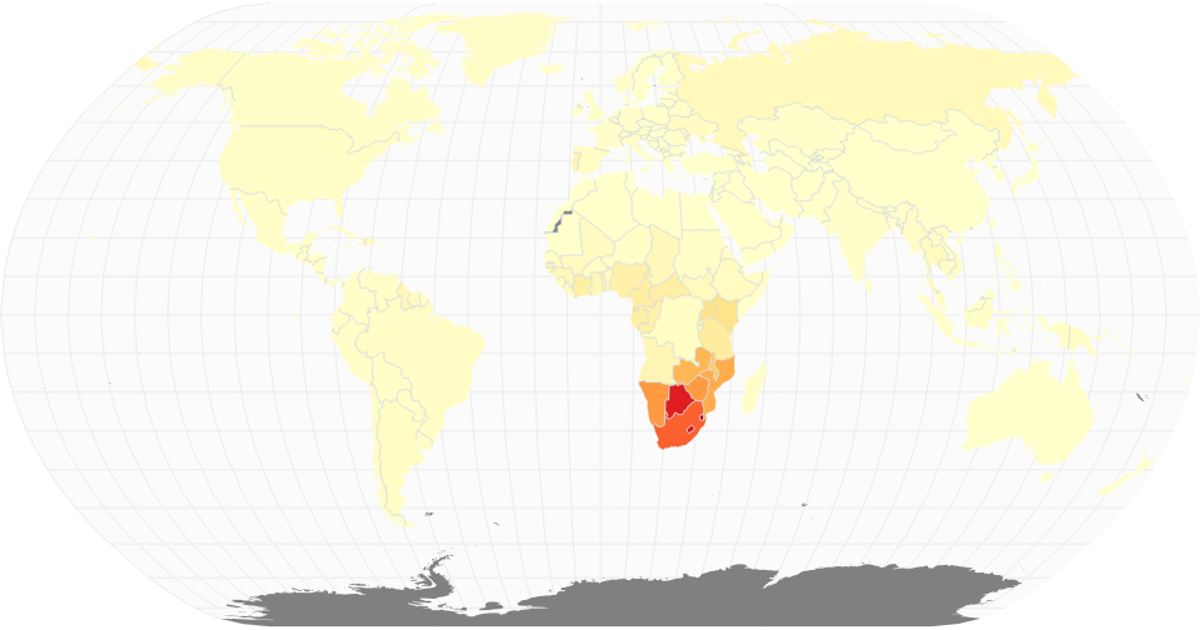
This choropleth displays the distribution of HIV/AIDS prevalence among adults aged 15–49 for the year 2017, using a sequential yellow-orange-red color scale to encode infection rates across countries. The map renders with the Natural Earth projection through `d3.geoNaturalEarth1` and `d3.geoPath`, including graticules and interior boundaries. Data comes from an IHME CSV file, joined to country shapes via ISO codes. Missing values appear in gray, while React manages the component state and SVG rendering.
AI-generated descriptionScatter Plot with time series data. All date and time data needs to follow (ISO 8601) time and date formatting for proper plotting. [https://en.wikipedia.org/wiki/ISO_8601].
MIT Licensed



Comments
Sign in to join the discussion.