🌍 Public
Customize axis
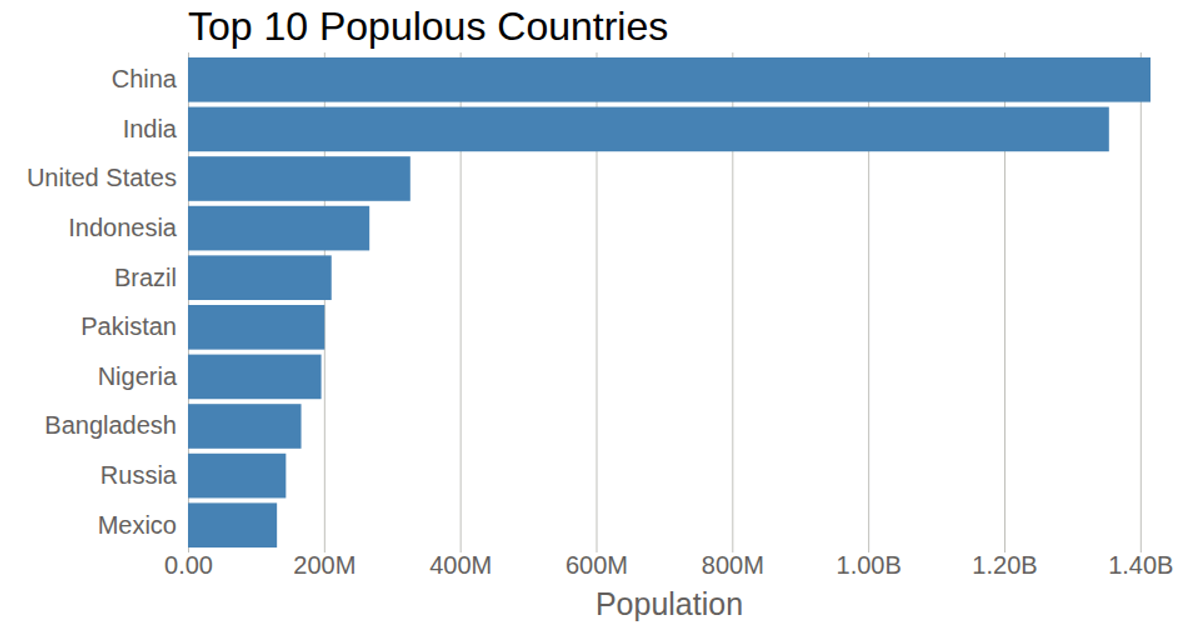
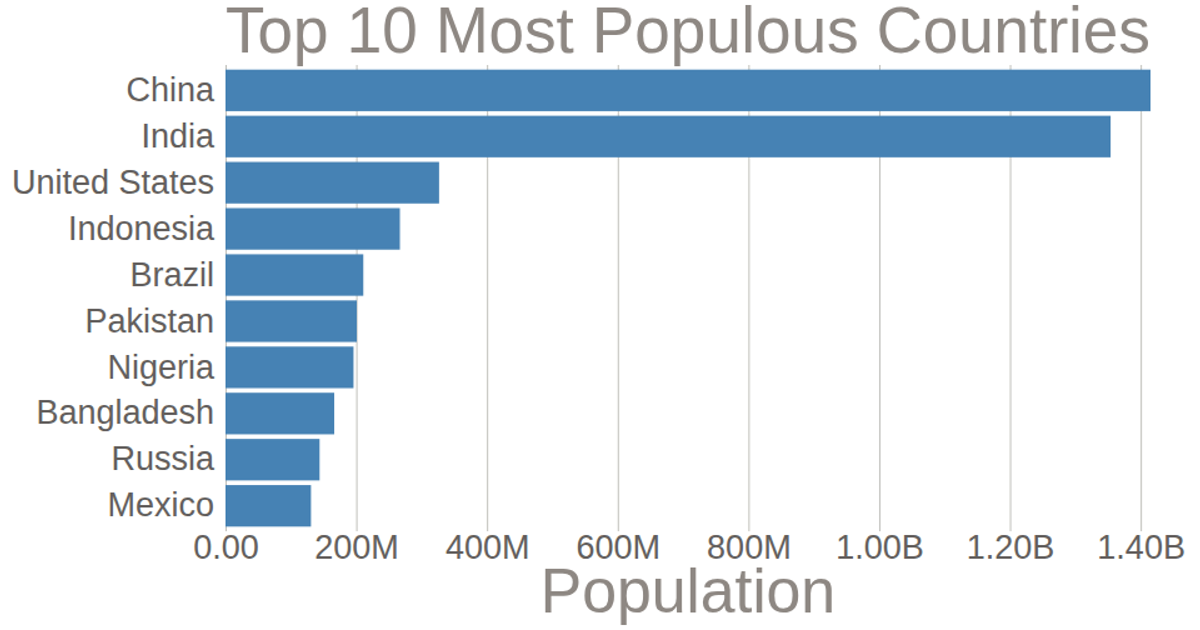
This example demonstrates a horizontal bar chart of population data for the top ten countries, with customized axes to improve readability. The y-axis displays country names using `scaleBand`, while the x-axis uses `scaleLinear` with a tick format of `format('.2s')` to abbreviate large population numbers (e.g., millions). The visualization is rendered as SVG elements, with data loaded from a CSV file and processed by multiplying population values by 1,000. The chart uses `axisLeft` and `axisBottom` to generate the axes within a margin-defined layout.
AI-generated descriptionA bare minimum HTML page.
See also React Starter.
MIT Licensed


Comments
Sign in to join the discussion.