🌍 Public
Fork of Ice6_Question 2
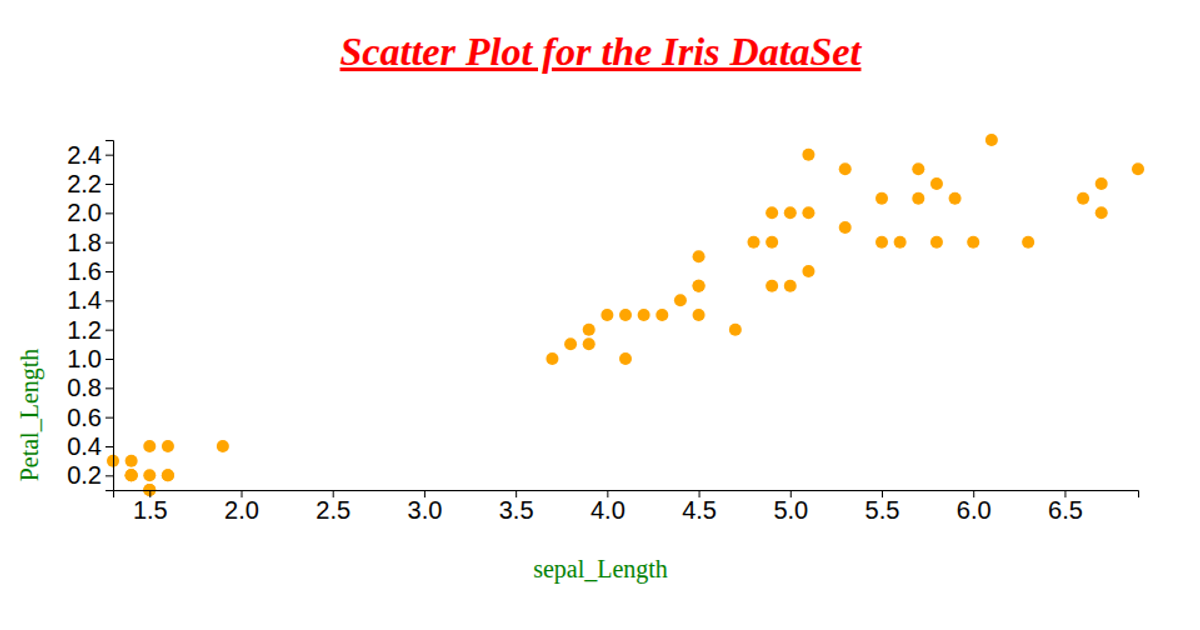
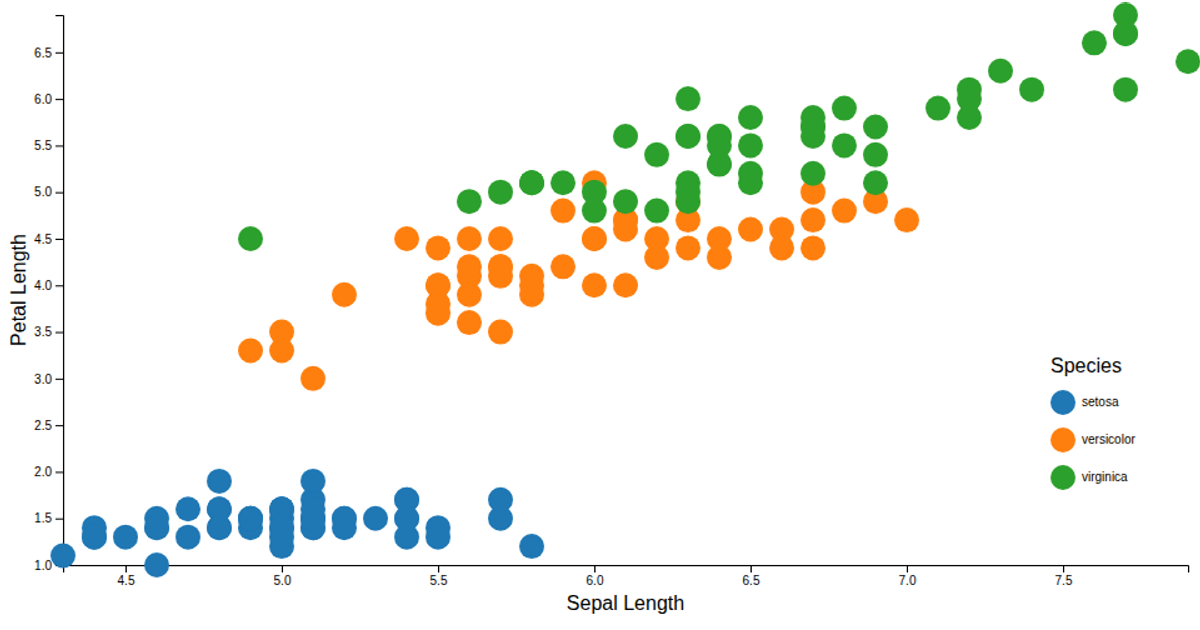
This scatter plot visualizes the Iris flower dataset, showing sepal length and width for 150 samples, with color encoding distinguishing the three species (Setosa, Versicolor, Virginica) as labeled clusters. Built with D3 v7, it uses `d3.scaleLinear` for positioning points, `d3.scaleOrdinal` for species-based coloring, and SVG circles with hover interactions that increase opacity and stroke width. The data is loaded from a remote CSV via `d3.csv`, and axes plus a legend are rendered using D3’s SVG components.
AI-generated descriptionMIT Licensed




Comments
Sign in to join the discussion.