🌍 Public
Fork of Vega-Lite API Template
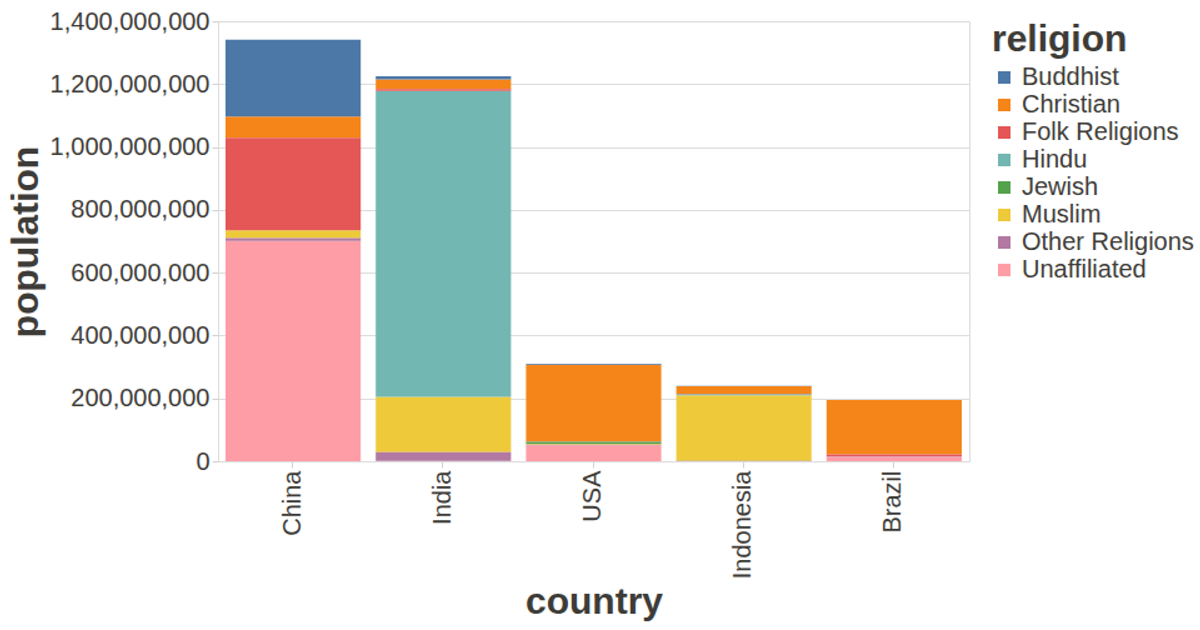
This interactive bar chart visualizes population density across divisions of Bangladesh, with bars sized by area in square kilometers and colored by district. The visualization uses the Vega-Lite API’s `markBar` encoding with x and y quantitative fields, while tooltips show district names. Data is loaded asynchronously via `d3.csv` from a Gist hosting the UCI Auto MPG dataset. Custom axis styling and tooltip styling are applied through a config object, and the chart renders with an SVG renderer via `vl.register`, adapting to the full window viewport.
AI-generated descriptionA visualization constructed using the vega-lite-api.
The data shown here comes from the UCI Machine Learning Repository: Auto MPG Data Set, via Gist: Scatter Plot with Menus.
MIT Licensed


Comments
Sign in to join the discussion.