🌍 Public
One programmer walks into a bar... D3.js
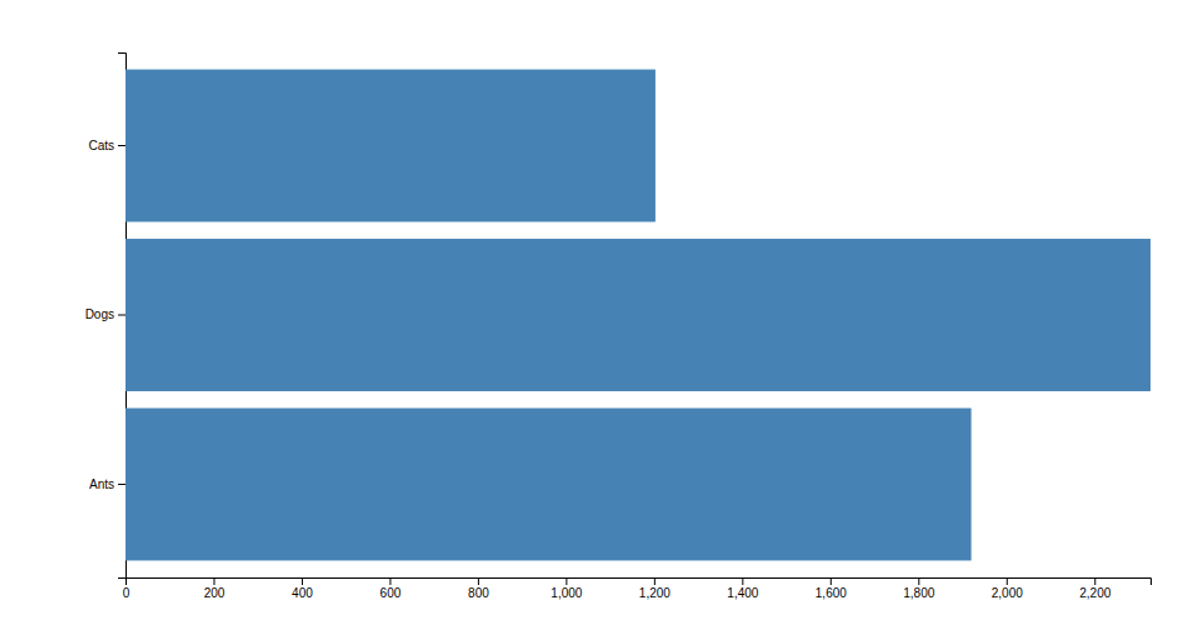
A bar chart displays the frequency of popular dog names from a CSV dataset, with horizontal bars showing counts for names like Bella and Max. The visualization uses D3.js v5 with SVG rendering, employing `scaleLinear` for the x-axis count scale and `scaleBand` for the categorical y-axis names. Axes are generated via `axisLeft` and `axisBottom`, while `csv` loads the data and rect elements are bound to the values.
AI-generated descriptionMIT Licensed







Comments
Sign in to join the discussion.