🌍 Public
Fork of Progress S Curve
This chart visualizes project progress as an S-curve, comparing planned versus actual cumulative values over time, with milestone markers and a bar chart of monthly increments. It uses D3 v7 to render SVG elements including lines, areas, and rectangles. The implementation supports synchronized zooming and panning on both axes through d3.zoom, with separate zoom behaviors for X and Y. The data loads from a CSV file containing plan, actual, and date fields.
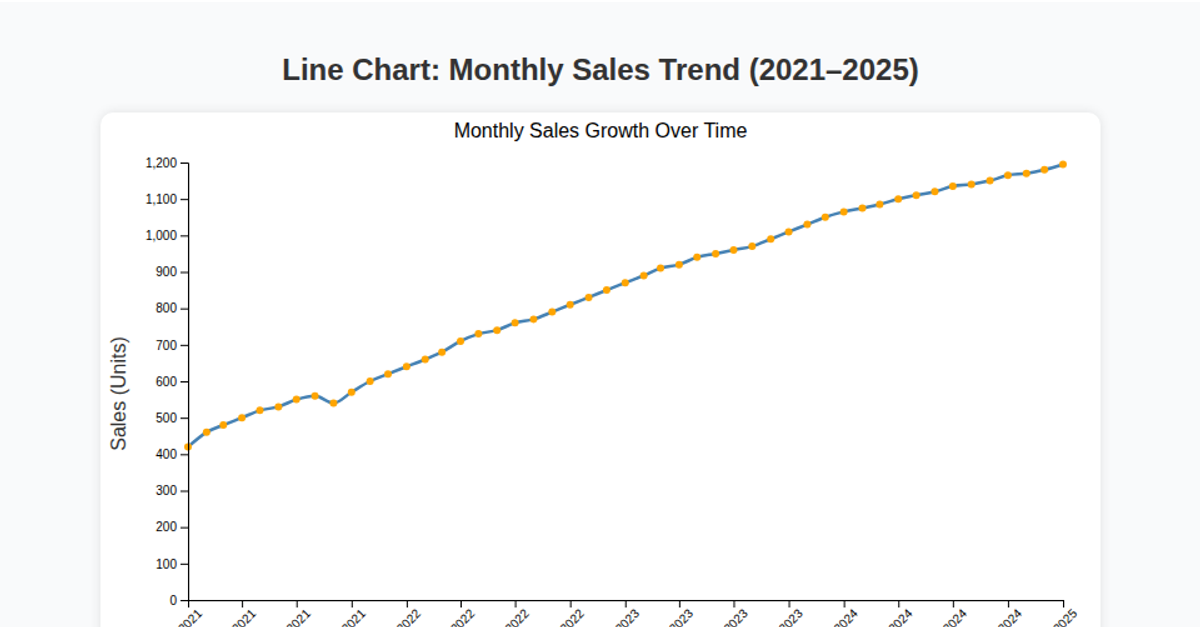
AI-generated descriptionThis line chart shows one week of temperature (in degrees Celcius) in San Francisco. The data comes from Data Canvas - Sense Your City. To do list
- Panning control in Min & Max of both axis
- Force fitting of data lable : https://lvngd.com/blog/rectangular-collision-detection-d3-force-layouts/ https://bl.ocks.org/mbostock/8033015 http://bl.ocks.org/larskotthoff/11406992
- default state of zoom by Home button
- Milestone on/off toggle button:
MIT Licensed



Comments
Sign in to join the discussion.