🌍 Public
Scatter 🅿️lot w/ Ⓜ️enu💰
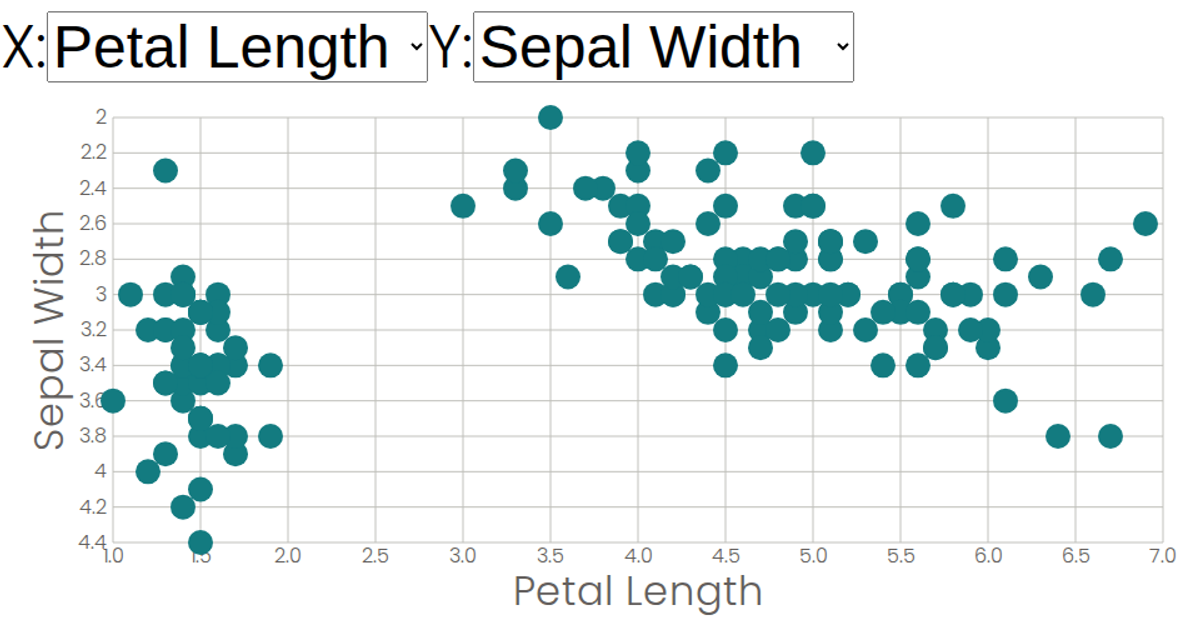
This scatter plot visualizes the Iris dataset, allowing users to explore relationships between different flower measurements. Two dropdown menus let users independently select which attribute to display on the X and Y axes from options including sepal and petal dimensions, as well as species. The code uses React for the interface and D3 v5 for the SVG rendering, employing `scaleLinear` for axes, `extent` for domain calculation, and a custom `Dropdown` component to manage the interactive attribute selection.
AI-generated descriptionA scatter plot of The Iris Dataset.
MIT Licensed






Comments
Sign in to join the discussion.