🌍 Public
Transformingdata
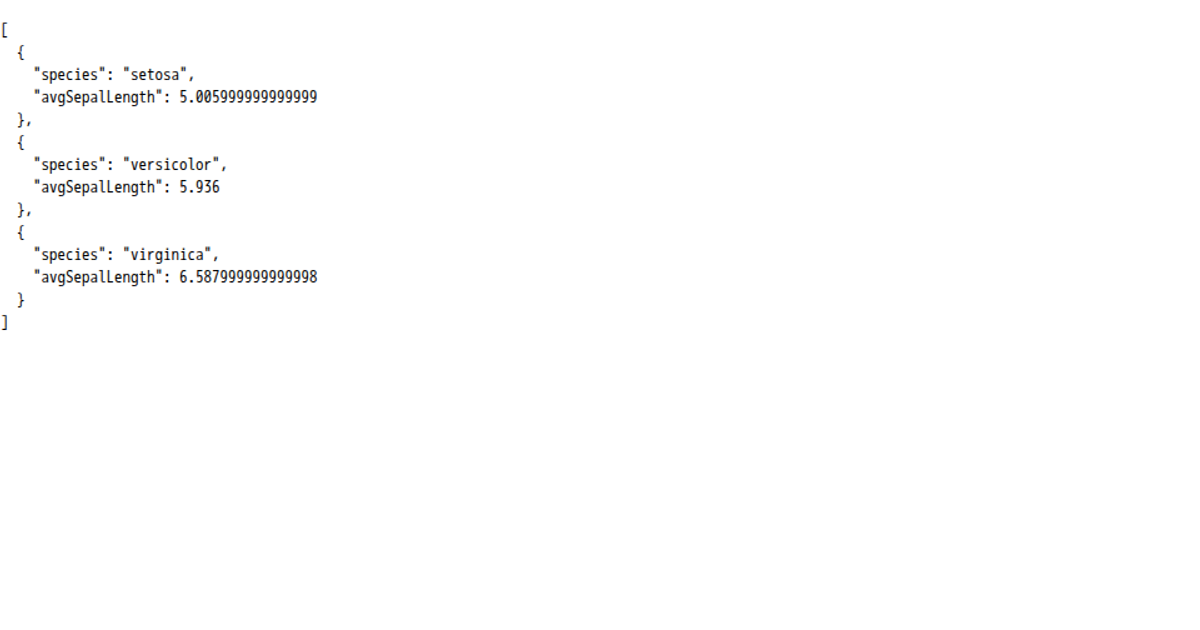
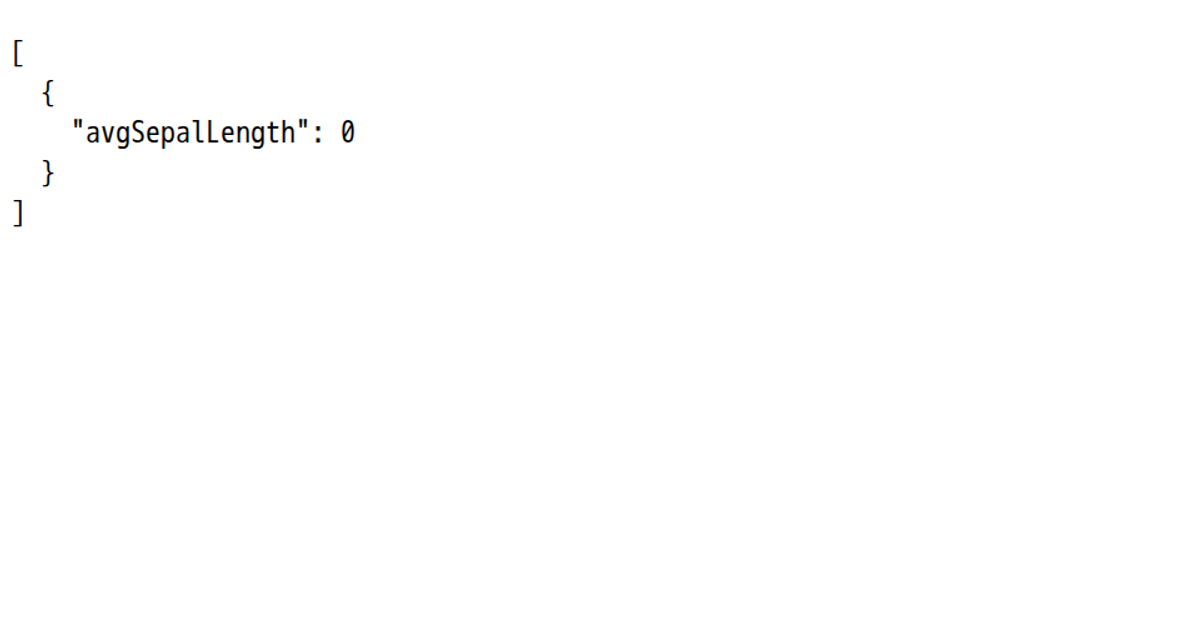
This example demonstrates a data-transformation workflow using the classic Iris dataset. It calculates the average sepal length for each iris species and displays the result as a formatted JSON summary. The visualization uses D3.js version 7, specifically leveraging `flatRollup` and `sum` to aggregate the data, while `csvParse` handles loading the CSV file. The code also showcases VizHub's ability to import D3 modules and local ES6 modules, fetching the data asynchronously and displaying the computed summary in a `<pre>` element.
AI-generated descriptionMIT Licensed




Comments
Sign in to join the discussion.