🌍 Public
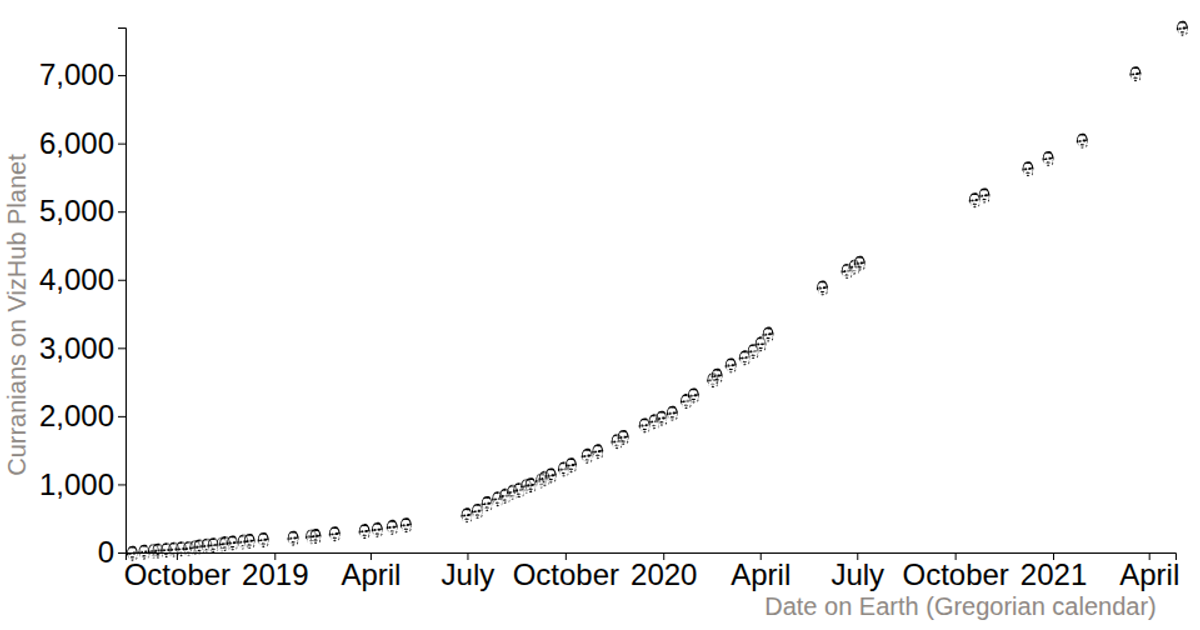
Fork of Reusable D3 Scatter Plot with Curran's Symbols
Rrichard.adamson@hotmail.com
Last edited Oct 15, 2024
Created on Oct 15, 2024
Forked from Reusable D3 Scatter Plot with Curran's Symbols
This scatter plot shows the growth of Curran’s user base over time, with each data point rendered as a custom “curran” symbol rather than a standard geometric marker. The visualization loads a CSV dataset and uses D3’s `scaleTime` and `scaleLinear` for the axes, while a custom SVG path (`paths.js`) is applied to each point via `selection.join('path')` and `transform` scaling. An ordinal scale maps symbol values, and hover tooltips are added with `title` elements. The chart includes axis labels generated by `axisLeft` and `axisBottom`.
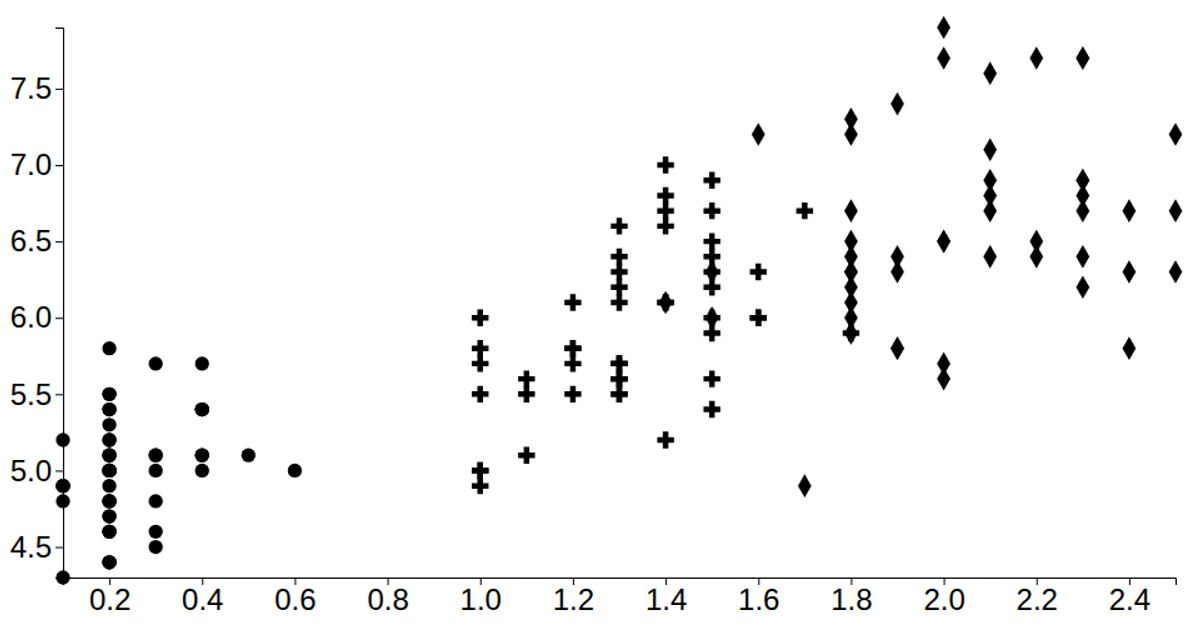
AI-generated descriptionA vanilla HTML implementation of a D3 scatter plot. Shows the Iris Dataset.
MIT Licensed





Comments
Sign in to join the discussion.