🌍 Public
Line Chart 11719939
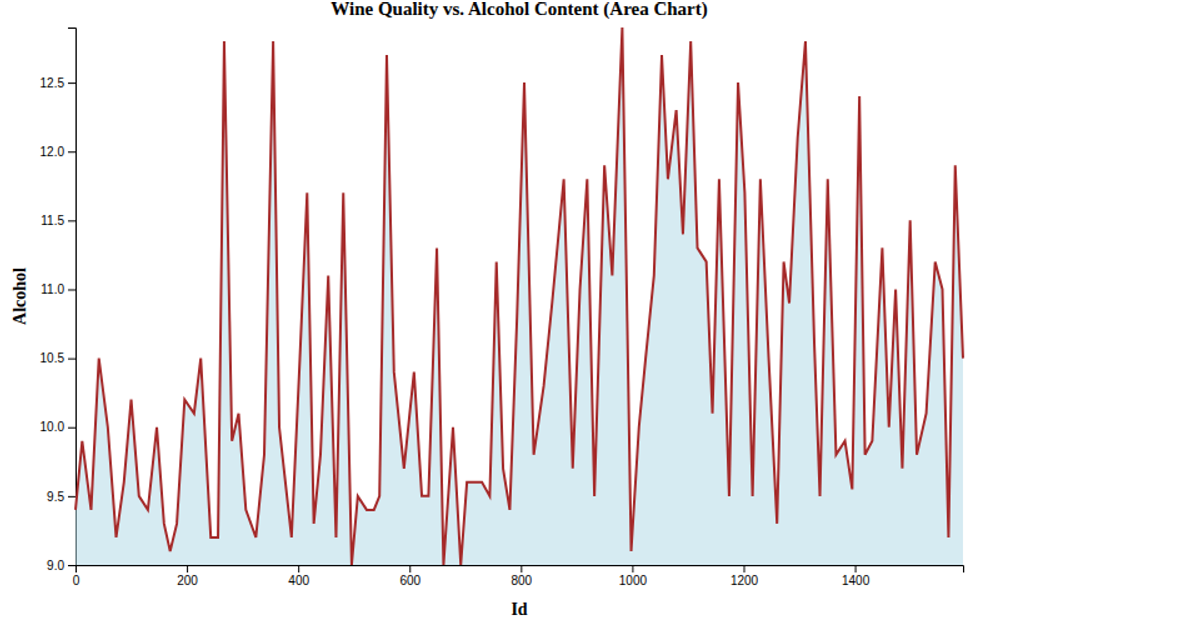
This line chart visualizes the relationship between wine sample ID and alcohol content using a log-scaled y-axis and a smoothed, curved line. It loads a CSV dataset from a GitHub gist via `d3.csv`, samples every tenth data point, and applies a moving average to reduce noise. The chart is rendered in SVG with D3 v7, using `d3.scaleLog`, `d3.line` with `curveCatmullRom`, and `d3.axisBottom`/`d3.axisLeft`. Axis labels and a title annotate the visualization.
AI-generated descriptionMIT Licensed




Comments
Sign in to join the discussion.