🌍 Public
creating a scatter Plot using iris dataset
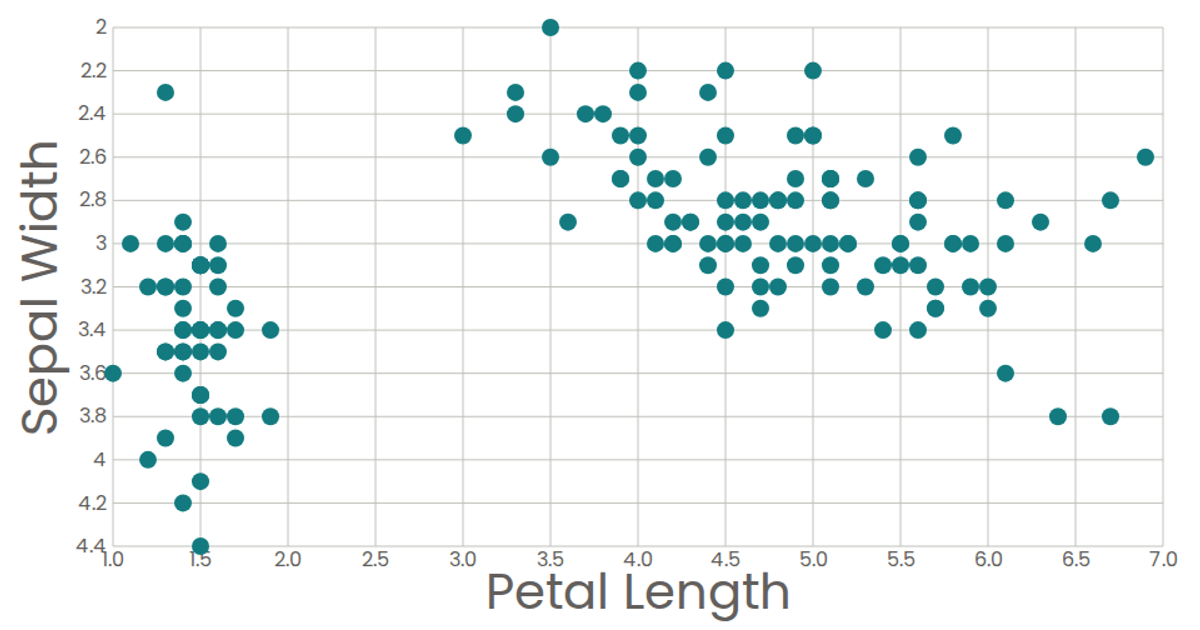
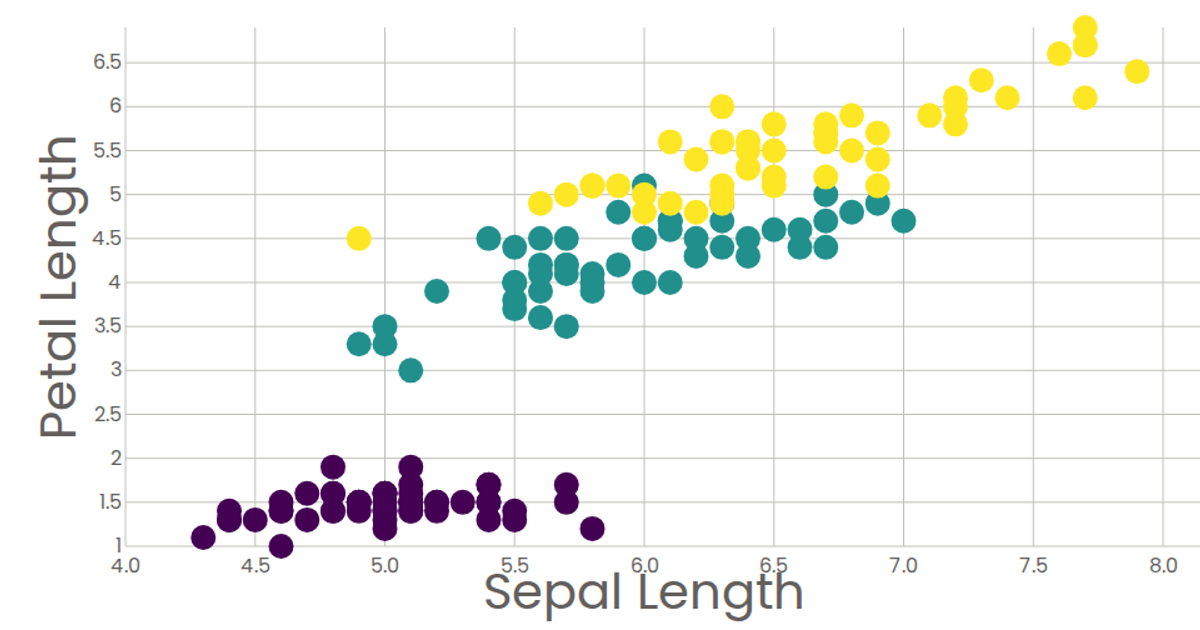
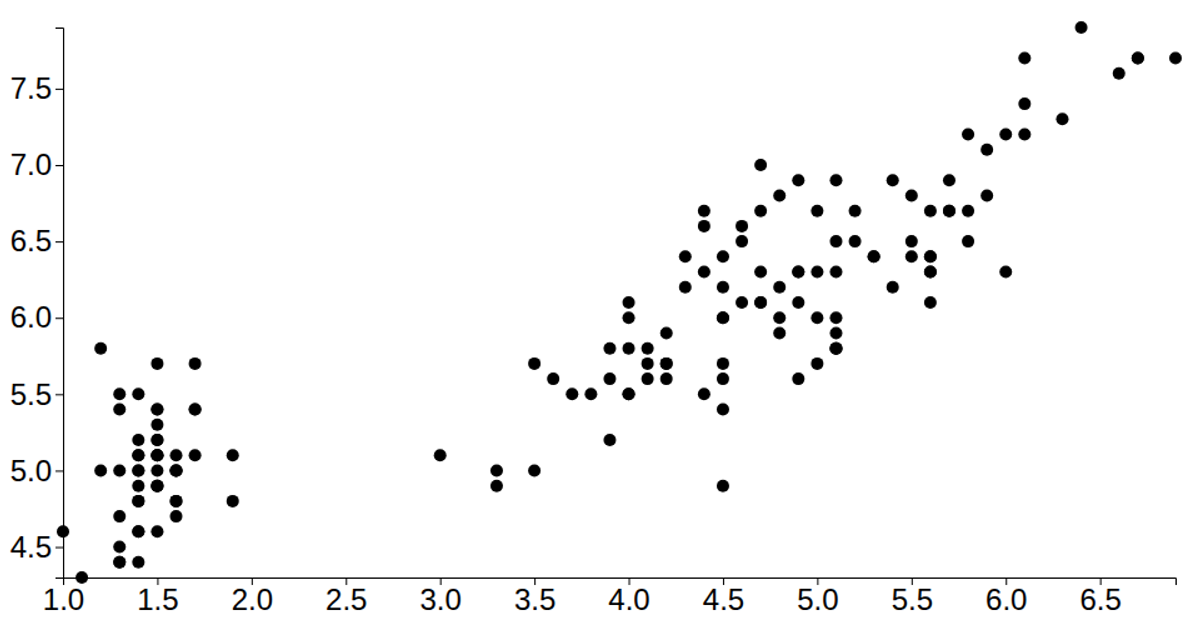
This scatter plot visualizes the relationship between petal length and sepal length for the classic Iris dataset, using purple circles to represent individual flowers. The React-based visualization uses D3 v5's `scaleLinear`, `extent`, and `csv` functions to load and scale the data, rendering the axes and marks as SVG elements. Axis tick labels are formatted with `format('.2s')`, and hover tooltips display the petal length value via an SVG `<title>` element.
AI-generated descriptionMIT Licensed





Comments
Sign in to join the discussion.