🌍 Public
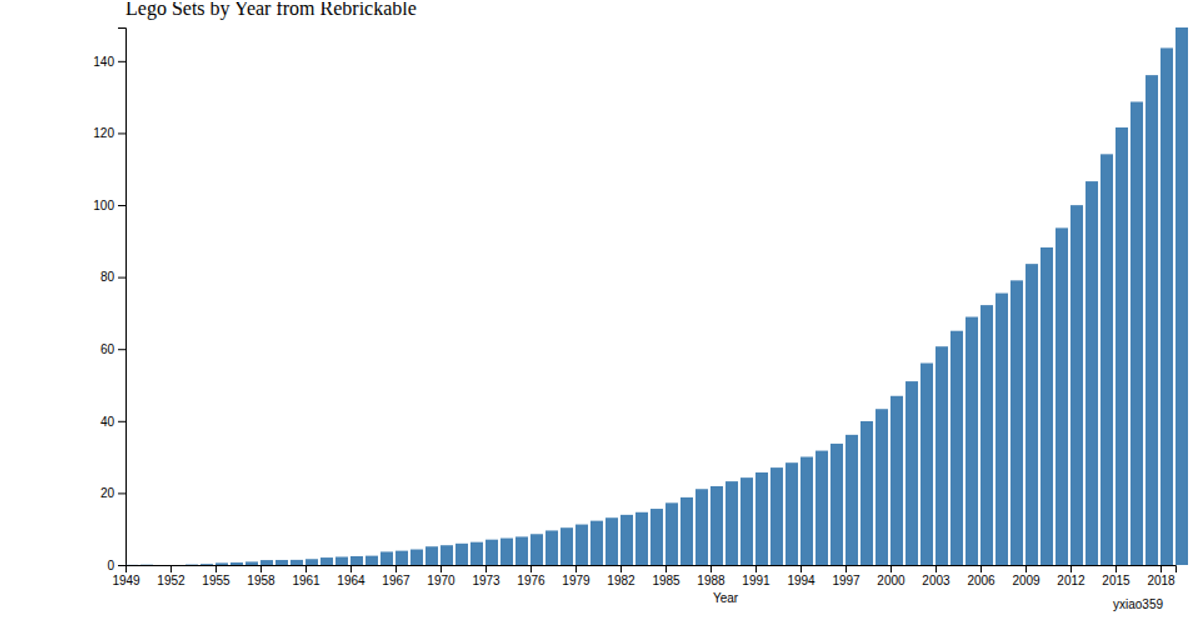
Rebrickable Lego Sets by Year
A bar chart displays the cumulative count of LEGO sets released each year, using a CSV of year and running total values. The visualization renders as an SVG with a date-scaled x-axis and a linear y-axis, using `d3.scaleTime()`, `d3.scaleLinear()`, and `d3.axisBottom()`/`d3.axisLeft()`. Bars are drawn via `d3.select("body")`, `g.selectAll('rect')`, and `.enter().append('rect')`, with animated transitions and custom axis-label styling.
AI-generated descriptionExample bar chart using D3.
MIT Licensed




Comments
Sign in to join the discussion.