🌍 Public
dispie
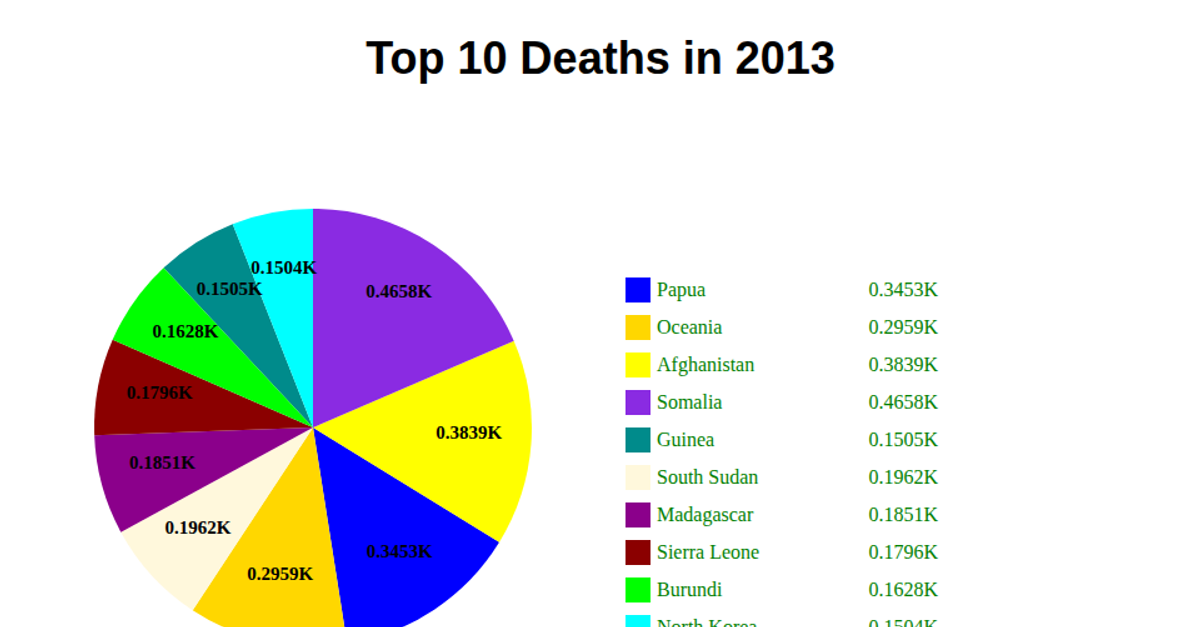
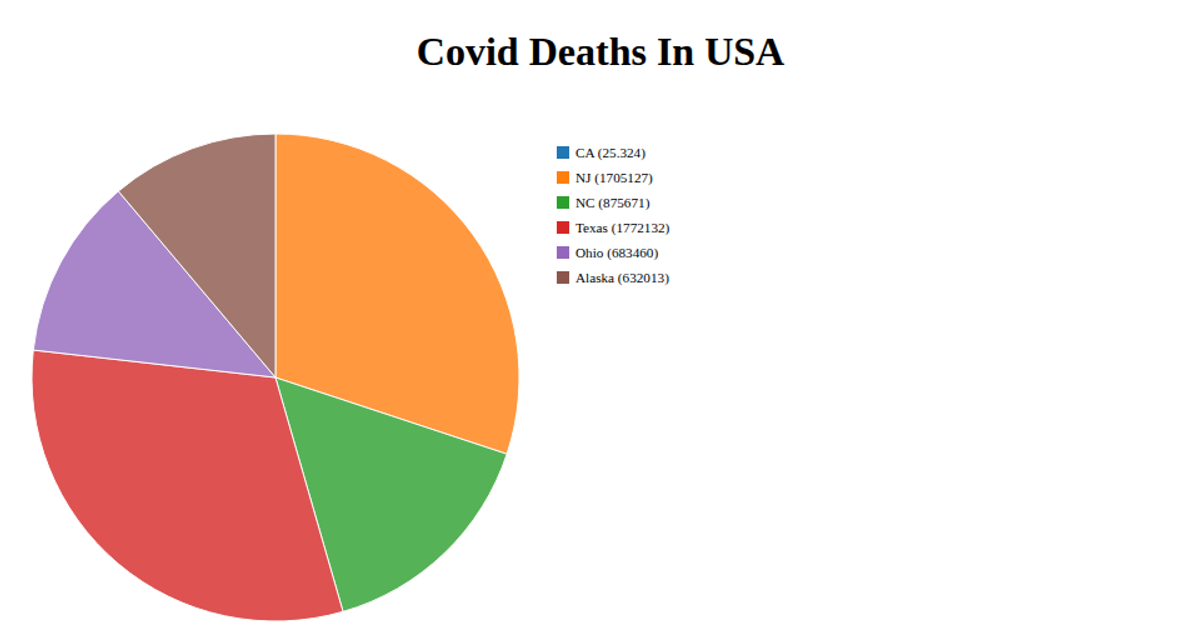
This pie chart shows the count of deaths by disaster type from 2000–2024, aggregating data into the top ten categories plus an “Others” slice. It uses React for component rendering and D3 v7’s `d3.pie`, `d3.arc`, and `d3.scaleOrdinal` to generate SVG paths and color slices. The code fetches a CSV via `d3.csv`, applies `d3.rollups` and `d3.sum` for aggregation, and adds interactive tooltips and percentage labels.
AI-generated descriptionA demonstration of how to start using D3 version 6.
MIT Licensed





Comments
Sign in to join the discussion.