🌍 Public
Activity 6 Question 4
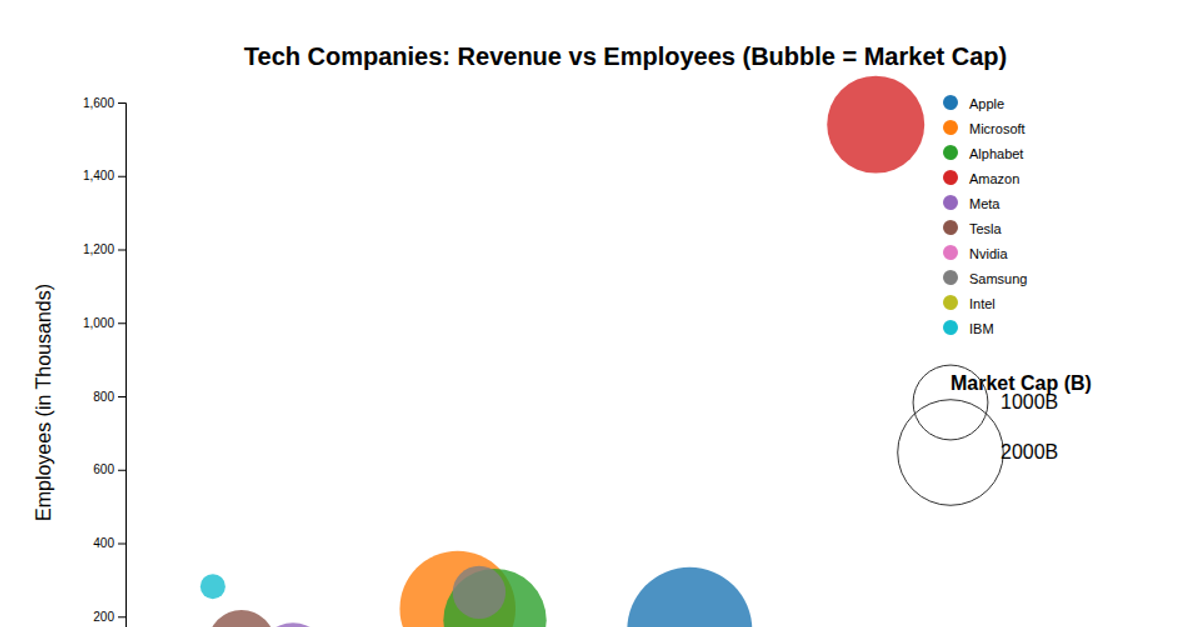
This example shows a stock market bubble chart that plots 12 companies by their percentage change in price against market capitalization, with bubble size representing trading volume and each company assigned a distinct color. Built with Chart.js, the visualization renders onto an HTML canvas element, using the library’s bubble chart type to map the x and y coordinates from the sample dataset. The code includes axis titles, a legend with adjustable font size, and a static dataset embedded directly in the script. The chart’s configuration options define scale labels and legend positioning, while the rendering relies on Chart.js’s internal canvas drawing rather than custom D3 code.
AI-generated descriptionAn example showing the capabilities of VizHub:
- Loads D3 via UNPKG.
- Demonstrates use of
importfrom"d3". - Demonstrates use of
importfrom local ES6 modules.
MIT Licensed




Comments
Sign in to join the discussion.