🌍 Public
Fork of Axes with React & D3
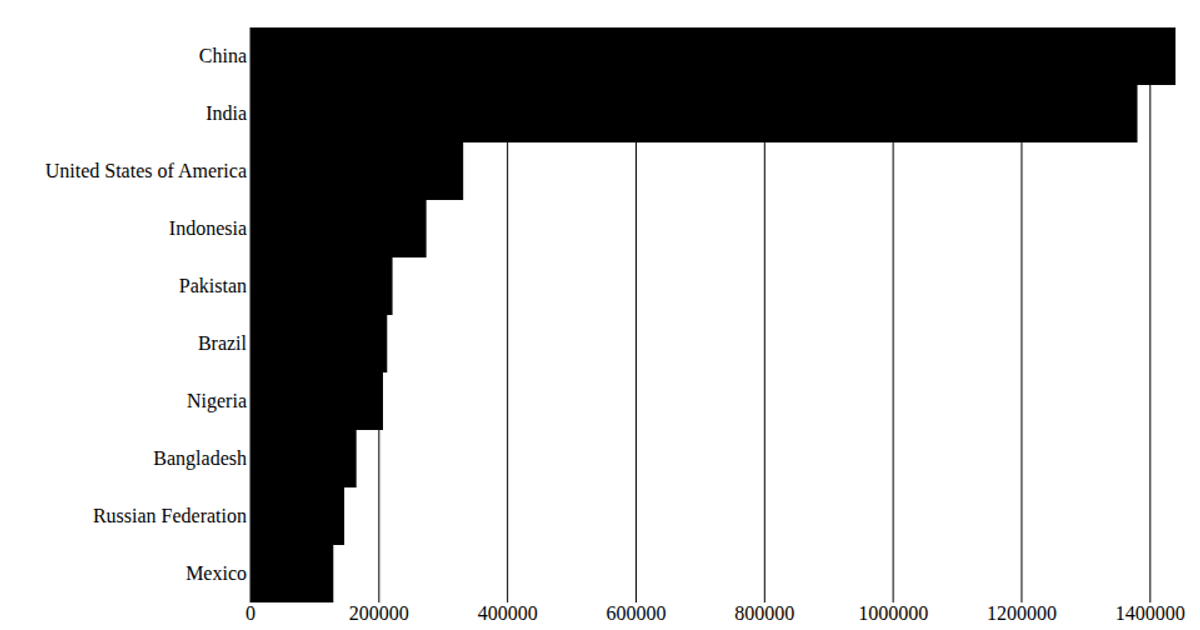
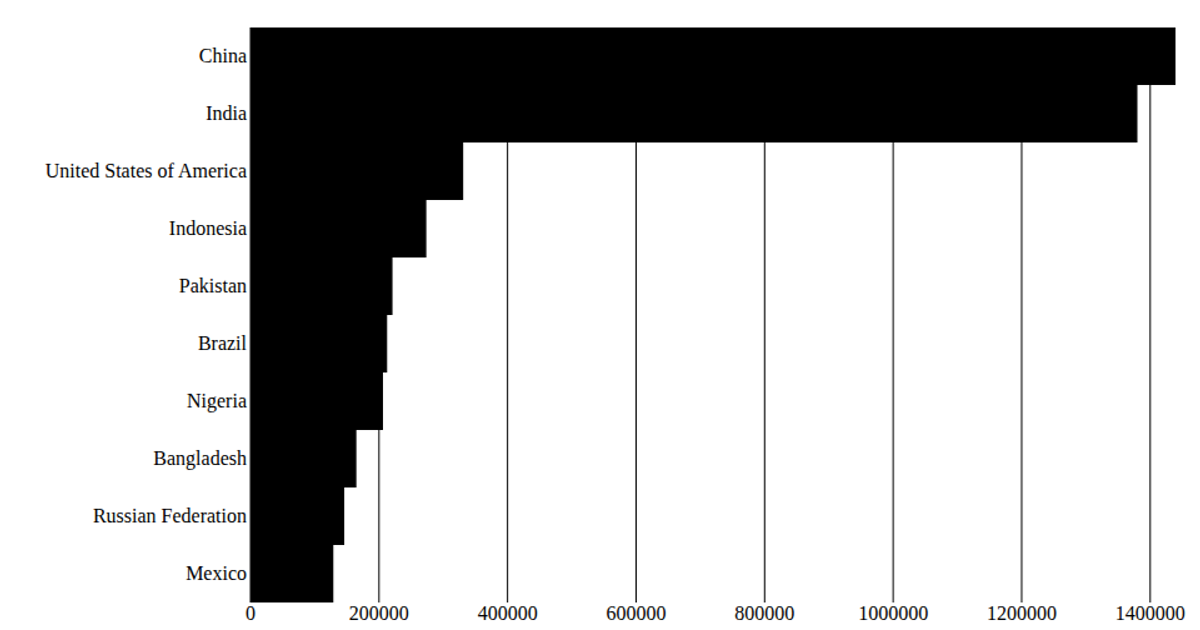
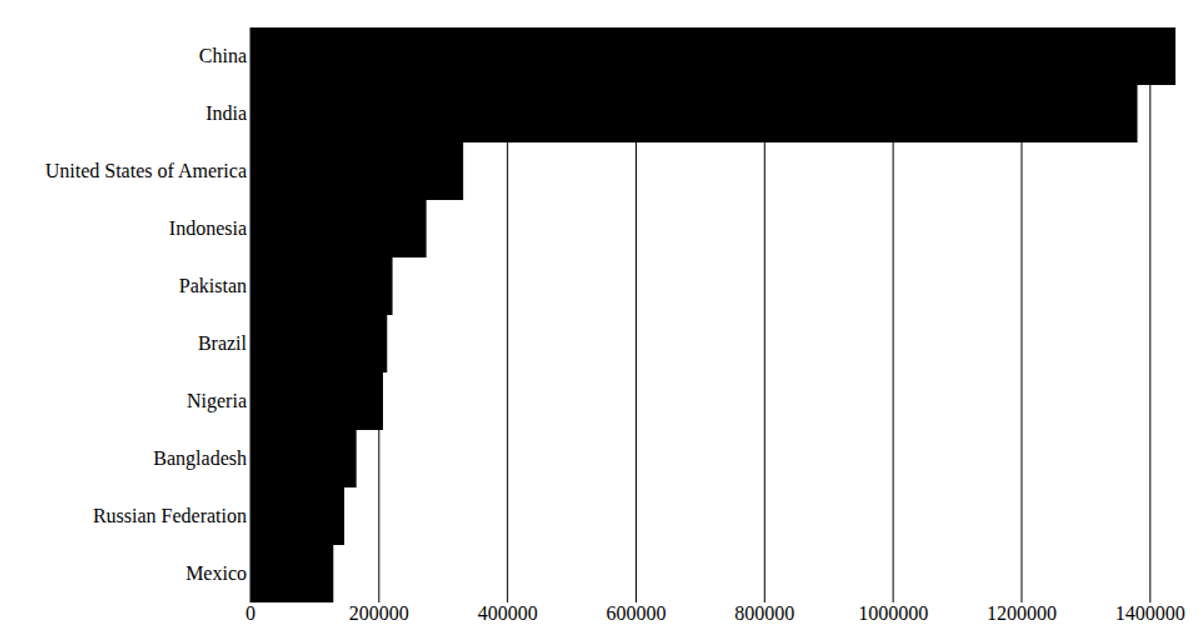
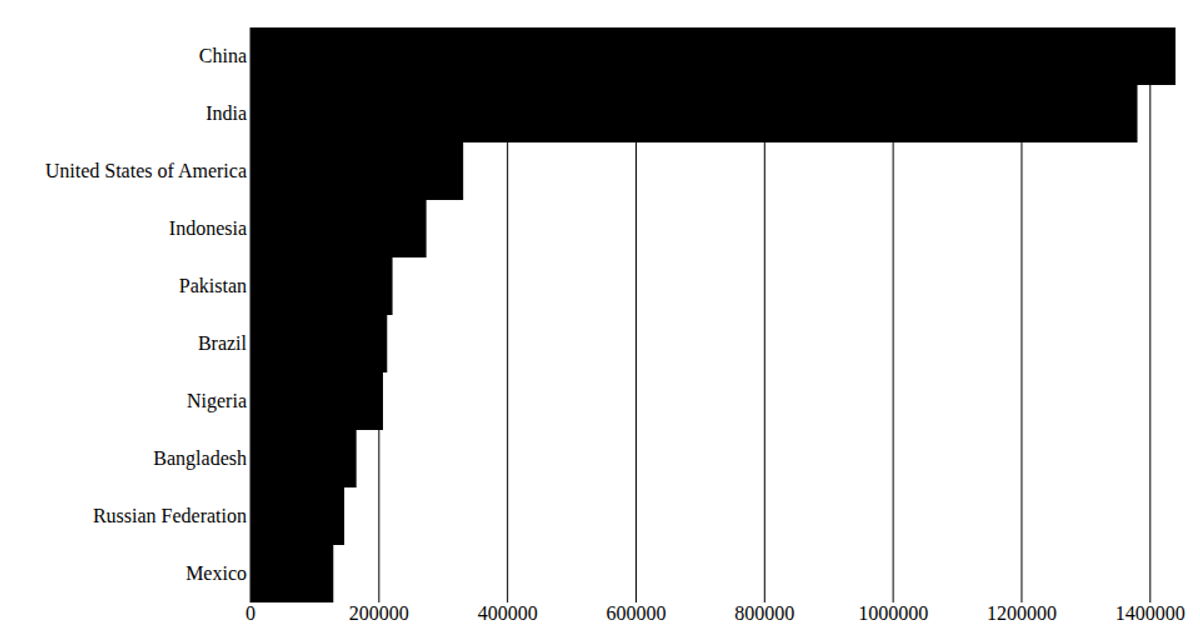
This example displays the top 10 most populous countries as horizontal bars with x-axis ticks and y-axis country labels. Built with React and D3, it loads United Nations population data for 2020 from a CSV file, then uses `scaleBand` and `scaleLinear` to position the bars and axis ticks. The SVG output is rendered through React's `ReactDOM.render`, with the chart dimensions and margins defined in the code.
AI-generated descriptionA program that shows the top 10 most populous countries as a pathetic bar chart with no axes.
MIT Licensed




Comments
Sign in to join the discussion.