🌍 Public
Activity8-Task2
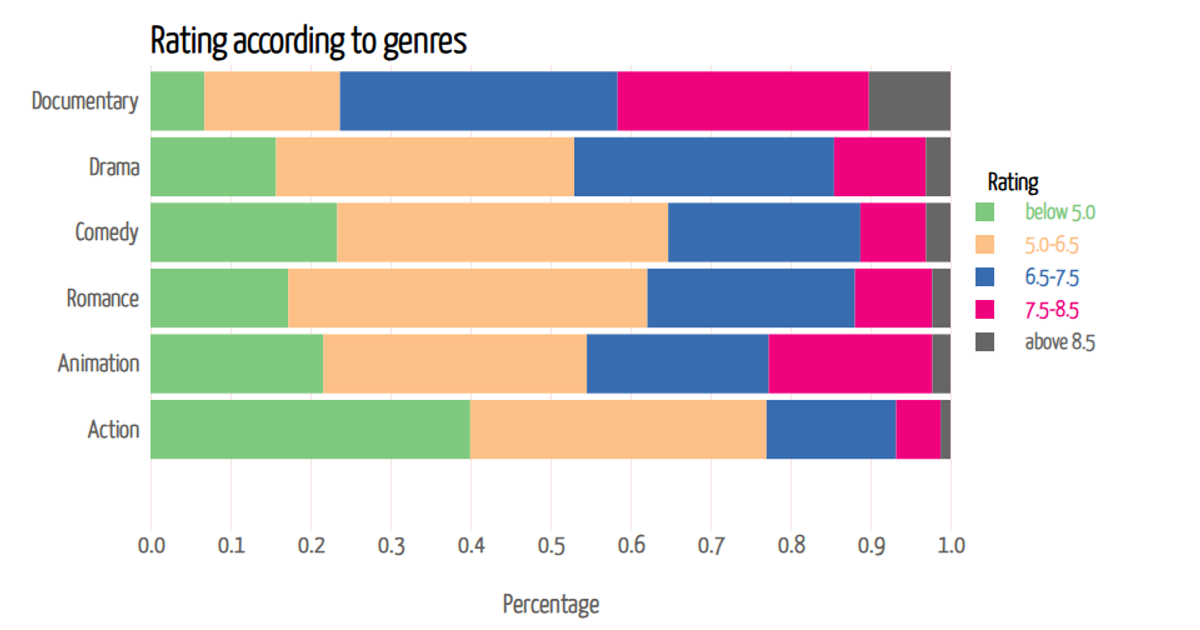
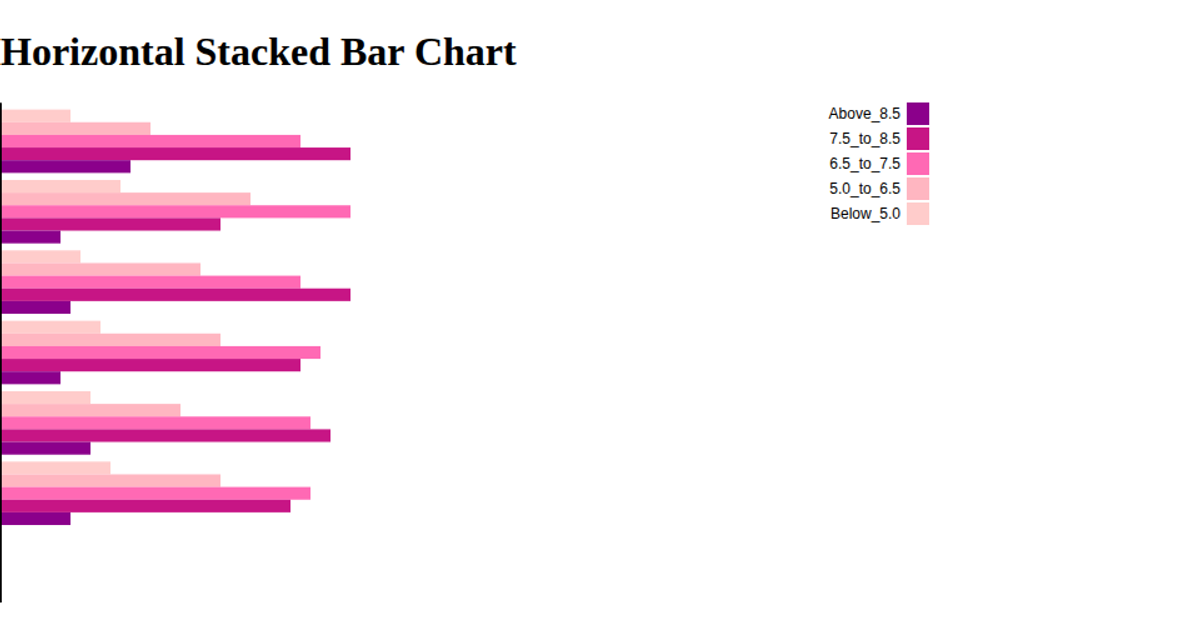
This visualization shows the distribution of rating percentages across six content categories, using stacked horizontal bars to compare five rating ranges per category. The chart, built with D3.js v7, uses a linear x-axis for percentage values and a categorical y-axis for genres, with each segment colored according to its rating band. Mouse interaction highlights individual segments and displays a tooltip showing the category name and precise percentage. Data comes from a CSV file with pre-calculated proportional values, rendered as SVG shapes with axes and legend generated via D3's axis and scale APIs.
AI-generated descriptionMIT Licensed



Comments
Sign in to join the discussion.