🌍 Public
Activity-8_Task-4
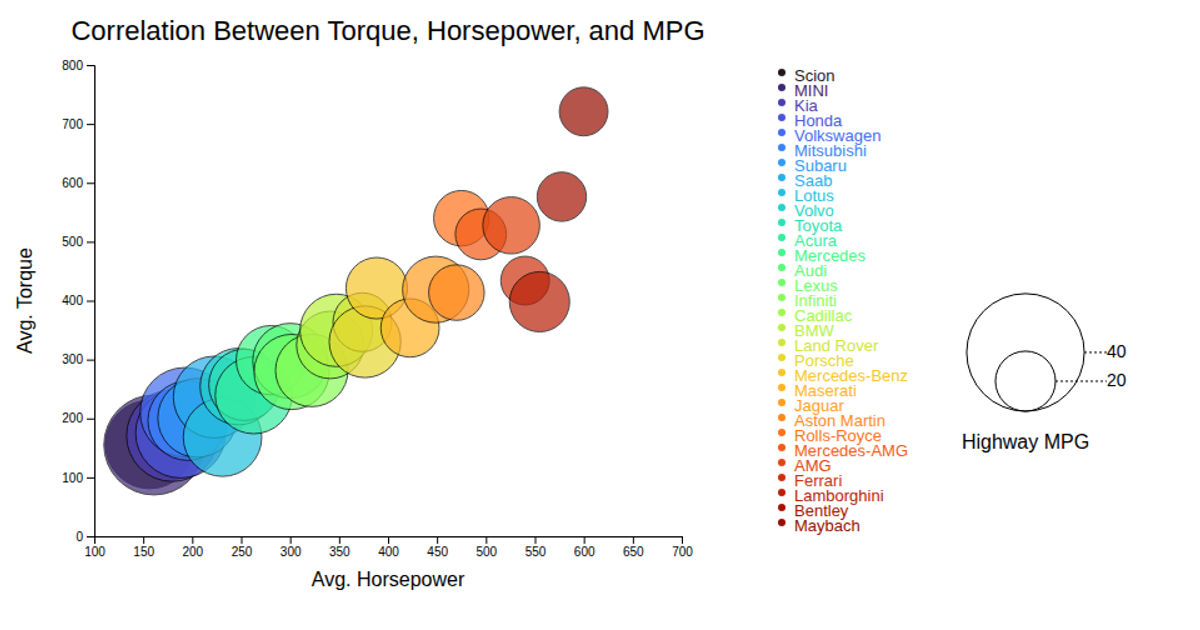
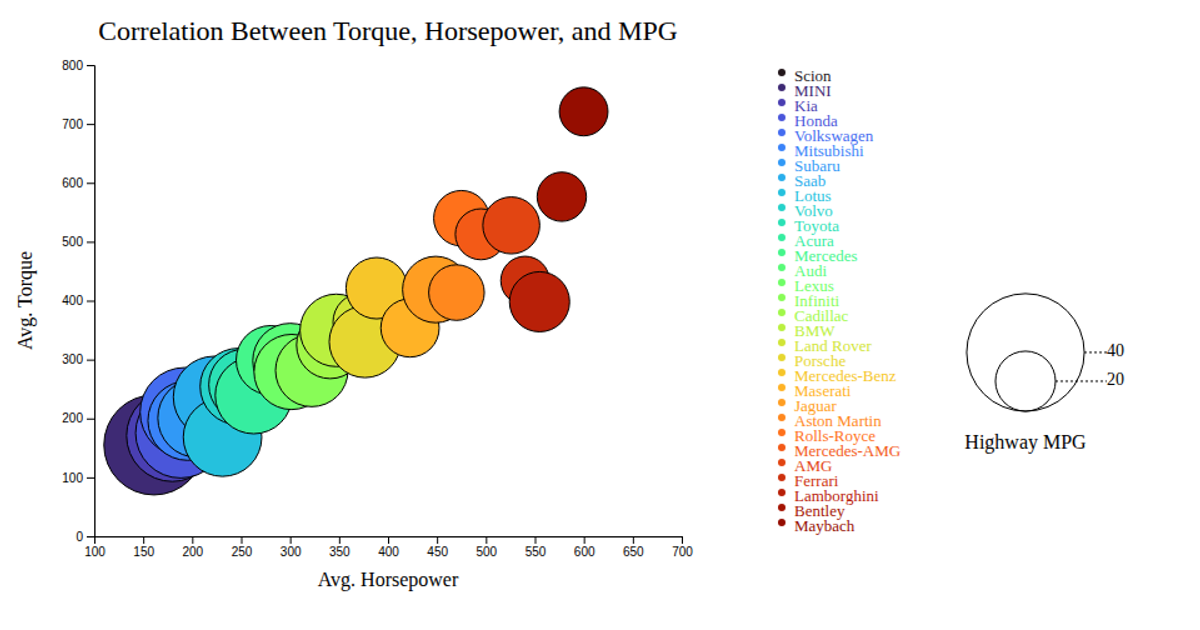
This bubble chart displays the correlation between average horsepower, torque, and highway MPG for various car makes, using a third dataset. Each circle’s position encodes horsepower (x-axis) and torque (y-axis), while its radius represents highway MPG, and its color distinguishes the car manufacturer. Built with D3 v7, the SVG visualization includes interactive tooltips that appear on mouseover, showing the vehicle’s make. The chart also features a legend for bubble sizes and color categories, with all axes and labels rendered using D3’s scale and axis functions.
AI-generated descriptionMIT Licensed



Comments
Sign in to join the discussion.