🌍 Public
Documentation Dashboard
AAbdulazizfh
Last edited Feb 24, 2021
Created on Feb 24, 2021
Forked from Fork of Shapes and Colors with SVG and CSS
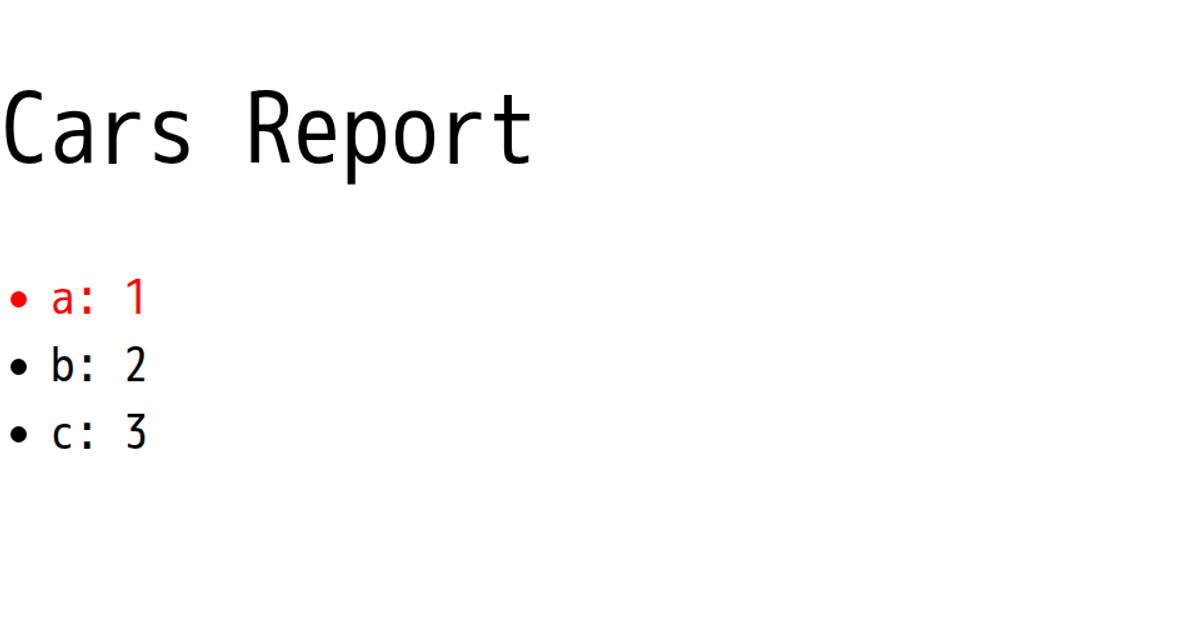
This dashboard displays software documentation usage as a compact, monospace-styled list of three categories (elie, m, a) with corresponding use-case counts (5, 10, 43). The rendered HTML lists the numbers as plain text items without interactive elements, relying solely on static markup and CSS. The page uses a simple `<ul>` structure with custom styling from `styles.css`, which sets a large 4em monospace font for readability, but does not employ any JavaScript libraries, data bindings, or dynamic rendering. The example demonstrates a minimal, typography-focused documentation overview.
AI-generated descriptionMIT Licensed






Comments
Sign in to join the discussion.