🌍 Public
Untitled
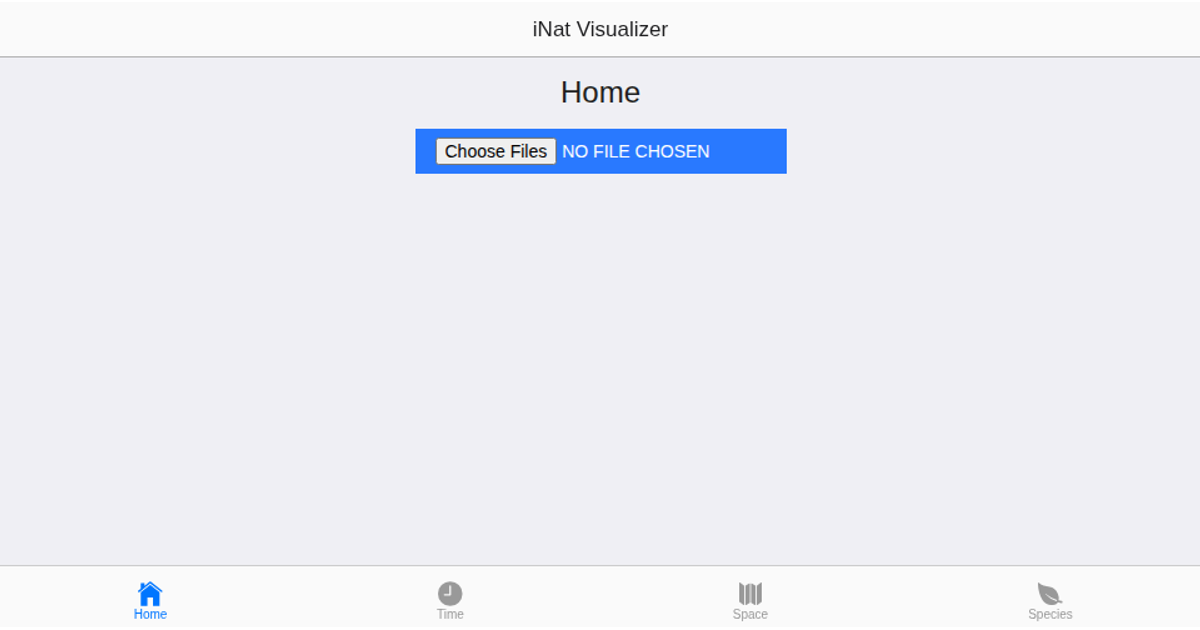
This example presents a mobile-style user interface for an iNaturalist data visualizer, built with the Onsen UI framework and jQuery. The interface includes a navigator with a tab bar offering five sections: Home, Time, Space, Species, and Settings. Each tab is a separate page template, with the Home page containing a file input for uploading CSV data. The JavaScript handles page initialization events and logs tab clicks through jQuery’s `$(document).ready` and `click` handlers, though the actual data visualization logic is not yet implemented.
AI-generated descriptionA bare minimum HTML page.
See also React Starter.
MIT Licensed


Comments
Sign in to join the discussion.