🌍 Public
Refactored Barchart
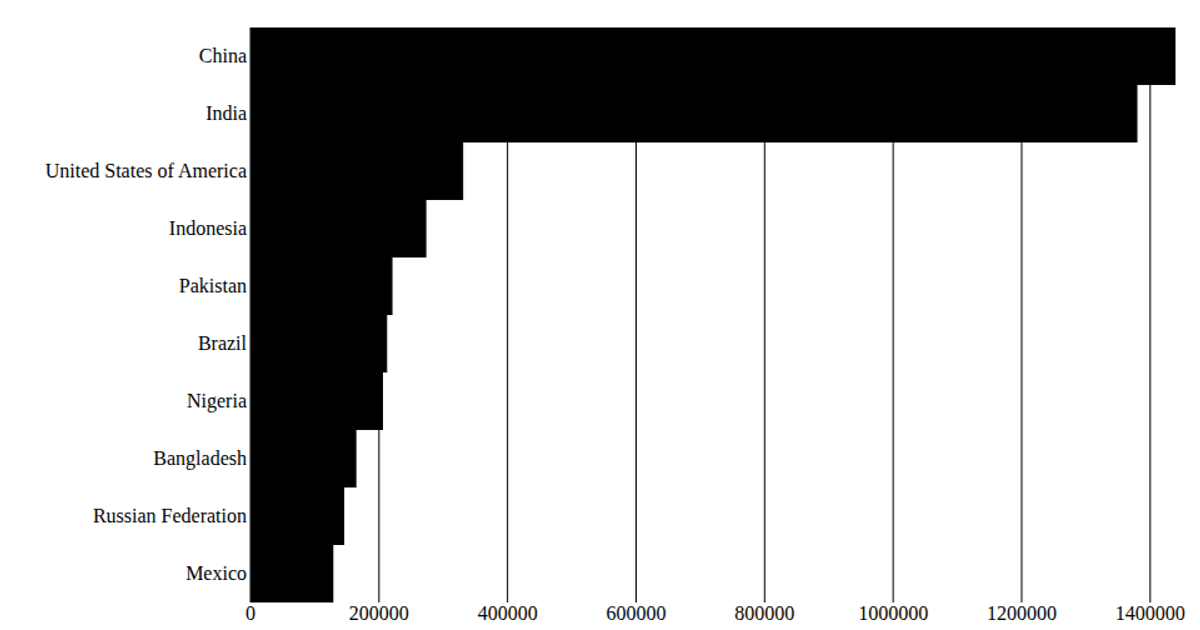
This horizontal bar chart displays the population of ten countries from the UN Population 2019 dataset. React renders SVG elements, while D3’s `scaleBand` and `scaleLinear` position bars and axes. The `AxisBottom` and `AxisLeft` components generate ticks, and `Marks` maps data to rectangles with native `<title>` tooltips using `format(".2s")`. Population values are formatted as billions.
AI-generated descriptionMIT Licensed




Comments
Sign in to join the discussion.